In a large class of introductory Statistics students, the professor has each person toss a fair coin 13 times and calculate the proportion of his or her tosses that were heads. The students then report their results, and the professor plots a histogram of these several proportions a) What shape would you expect this histogram to be? Why? b) Where do you expect the histogram to be centered? c) How much variability would you expect among these proportions? d) Explain why a Normal model should not be used here
In a large class of introductory Statistics students, the professor has each person toss a fair coin 13 times and calculate the proportion of his or her tosses that were heads. The students then report their results, and the professor plots a histogram of these several proportions a) What shape would you expect this histogram to be? Why? b) Where do you expect the histogram to be centered? c) How much variability would you expect among these proportions? d) Explain why a Normal model should not be used here

Glencoe Algebra 1, Student Edition, 9780079039897, 0079039898, 2018
18th Edition
ISBN:9780079039897
Author:Carter
Publisher:Carter
Chapter10: Statistics
Section10.5: Comparing Sets Of Data
Problem 14PPS

Related questions

Concept explainers
Contingency Table
A contingency table can be defined as the visual representation of the relationship between two or more categorical variables that can be evaluated and registered. It is a categorical version of the scatterplot, which is used to investigate the linear relationship between two variables. A contingency table is indeed a type of frequency distribution table that displays two variables at the same time.
Binomial Distribution
Binomial is an algebraic expression of the sum or the difference of two terms. Before knowing about binomial distribution, we must know about the binomial theorem.
Topic Video
Question
10
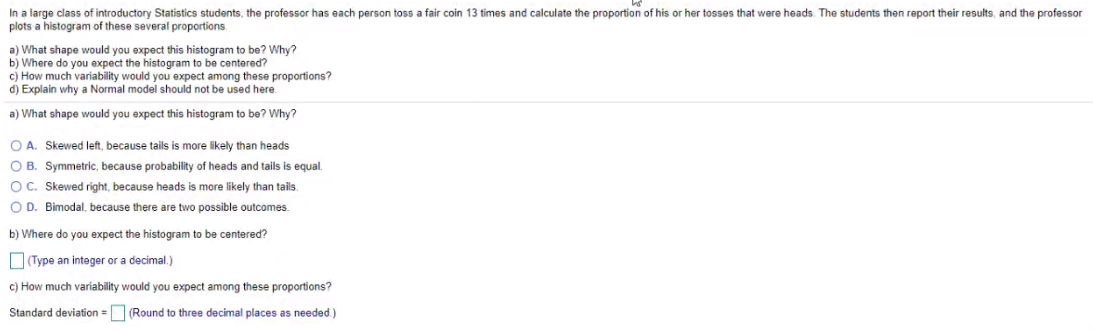
Transcribed Image Text:In a large class of introductory Statistics students, the professor has each person toss a fair coin 13 times and calculate the proportion of his or her tosses that were heads. The students then report their results, and the professor
plots a histogram of these several proportions.
a) What shape would you expect this histogram to be? Why?
b) Where do you expect the histogram to be centered?
c) How much variability would you expect among these proportions?
d) Explain why a Normal model should not be used here.
a) What shape would you expect this histogram to be? Why?
O A. Skewed left, because tails is more likely than heads
O B. Symmetric, because probability of heads and tails is equal.
OC. Skewed right, because heads is more likely than tails.
O D. Bimodal, because there are two possible outcomes.
b) Where do vou expect the histogram to be centered?
O(Type an integer or a decimal.)
c) How much variability would you expect among these proportions?
Standard deviation = Round to three decimal places as needed.)
Expert Solution
This question has been solved!
Explore an expertly crafted, step-by-step solution for a thorough understanding of key concepts.

This is a popular solution!

Trending now
This is a popular solution!

Step by step
Solved in 2 steps

Knowledge Booster


Learn more about
Need a deep-dive on the concept behind this application? Look no further. Learn more about this topic, statistics and related others by exploring similar questions and additional content below.Recommended textbooks for you
Glencoe Algebra 1, Student Edition, 9780079039897…
Algebra
ISBN:
9780079039897
Author:
Carter
Publisher:
McGraw Hill
Glencoe Algebra 1, Student Edition, 9780079039897…
Algebra
ISBN:
9780079039897
Author:
Carter
Publisher:
McGraw Hill