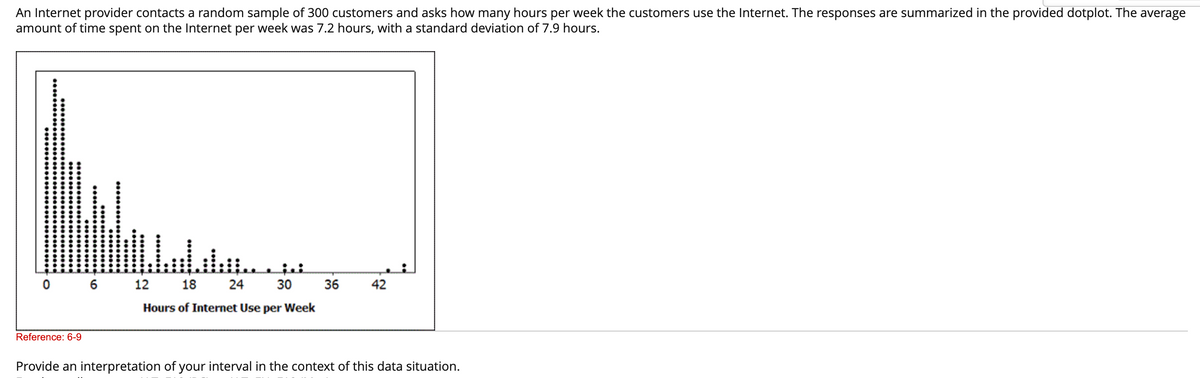
An Internet provider contacts a random sample of 300 customers and asks how many hours per week the customers use the Internet. The responses are summarized in the provided dotplot. The average amount of time spent on the Internet per week was 7.2 hours, with a standard deviation of 7.9 hours. 0 Reference: 6-9 6 12 18 24 30 Hours of Internet Use per Week 36 42 Provide an interpretation of your interval in the context of this data situation.
An Internet provider contacts a random sample of 300 customers and asks how many hours per week the customers use the Internet. The responses are summarized in the provided dotplot. The average amount of time spent on the Internet per week was 7.2 hours, with a standard deviation of 7.9 hours. 0 Reference: 6-9 6 12 18 24 30 Hours of Internet Use per Week 36 42 Provide an interpretation of your interval in the context of this data situation.

Glencoe Algebra 1, Student Edition, 9780079039897, 0079039898, 2018
18th Edition
ISBN:9780079039897
Author:Carter
Publisher:Carter
Chapter10: Statistics
Section10.5: Comparing Sets Of Data
Problem 13PPS

Related questions
Question
Transcribed Image Text:An Internet provider contacts a random sample of 300 customers and asks how many hours per week the customers use the Internet. The responses are summarized in the provided dotplot. The average
amount of time spent on the Internet per week was 7.2 hours, with a standard deviation of 7.9 hours.
0 6 12
24 30
18
Hours of Internet Use per Week
Reference: 6-9
36
42
Provide an interpretation of your interval in the context of this data situation.
Expert Solution
This question has been solved!
Explore an expertly crafted, step-by-step solution for a thorough understanding of key concepts.

This is a popular solution!

Trending now
This is a popular solution!

Step by step
Solved in 2 steps with 2 images

Recommended textbooks for you
Glencoe Algebra 1, Student Edition, 9780079039897…
Algebra
ISBN:
9780079039897
Author:
Carter
Publisher:
McGraw Hill
Glencoe Algebra 1, Student Edition, 9780079039897…
Algebra
ISBN:
9780079039897
Author:
Carter
Publisher:
McGraw Hill