Standard Error Which of the dotplots given in Exercise 7.33 has the largest standard error, and which has the smallest standard error?
Standard Error Which of the dotplots given in Exercise 7.33 has the largest standard error, and which has the smallest standard error?

Holt Mcdougal Larson Pre-algebra: Student Edition 2012
1st Edition
ISBN:9780547587776
Author:HOLT MCDOUGAL
Publisher:HOLT MCDOUGAL
Chapter11: Data Analysis And Probability
Section: Chapter Questions
Problem 7CR

Related questions
Question
7.35 only
Transcribed Image Text:7.34
7.35
7.36
7.37
0.0 0.1 0.2 0.3 0.4 0.5 0.6 0.7 0.8 0.9 1.0
Sample Proportion
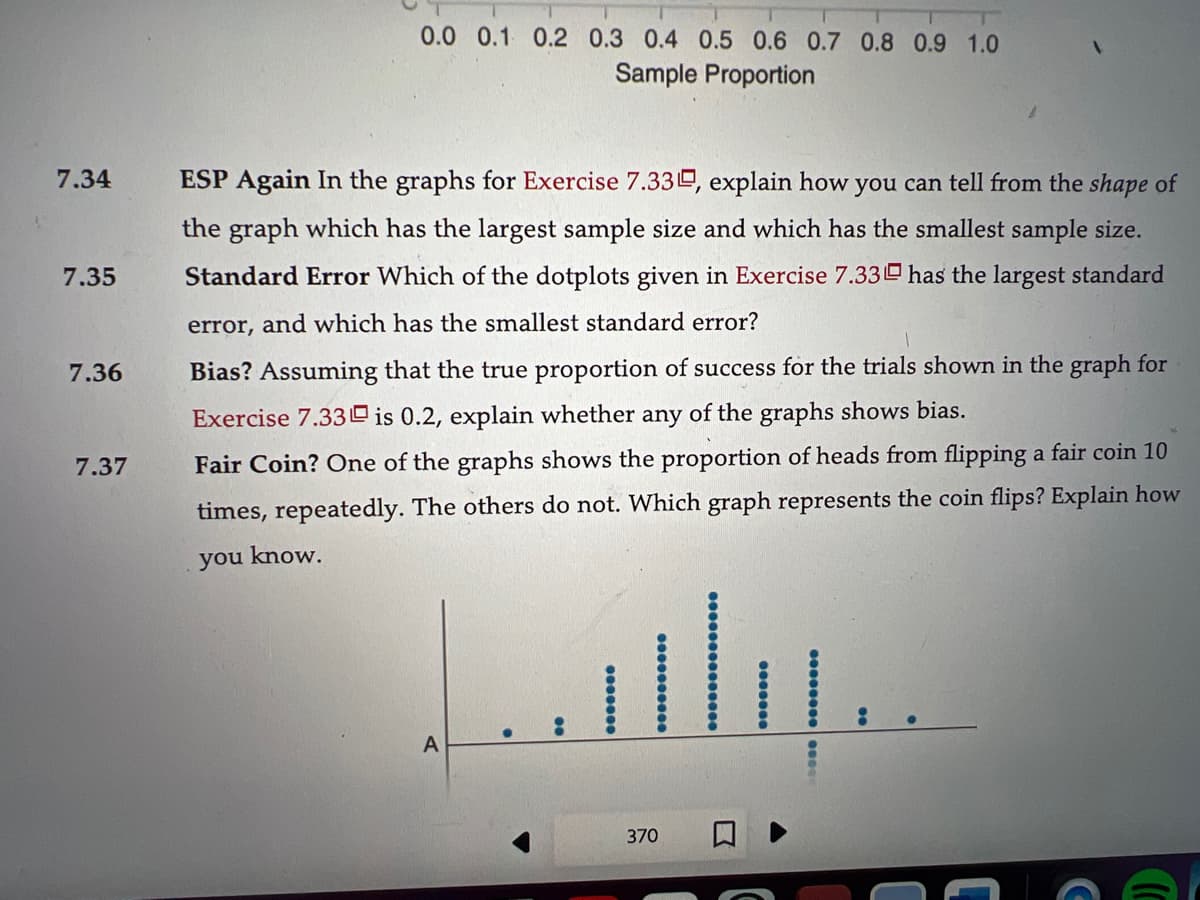
ESP Again In the graphs for Exercise 7.330, explain how you can tell from the shape of
the graph which has the largest sample size and which has the smallest sample size.
Standard Error Which of the dotplots given in Exercise 7.33 has the largest standard
error, and which has the smallest standard error?
Bias? Assuming that the true proportion of success for the trials shown in the graph for
Exercise 7.33 is 0.2, explain whether any of the graphs shows bias.
Fair Coin? One of the graphs shows the proportion of heads from flipping a fair coin 10
times, repeatedly. The others do not. Which graph represents the coin flips? Explain how
you know.
A
370
C
(C
Transcribed Image Text:Tab Window
X
Pomona Essay - Google X
JUL
22
Homework 3
-9403-abf9e2add3f5/pages/a0bb37b594411a2165621e3eb597416848138c219?location=%7B"id"%3...
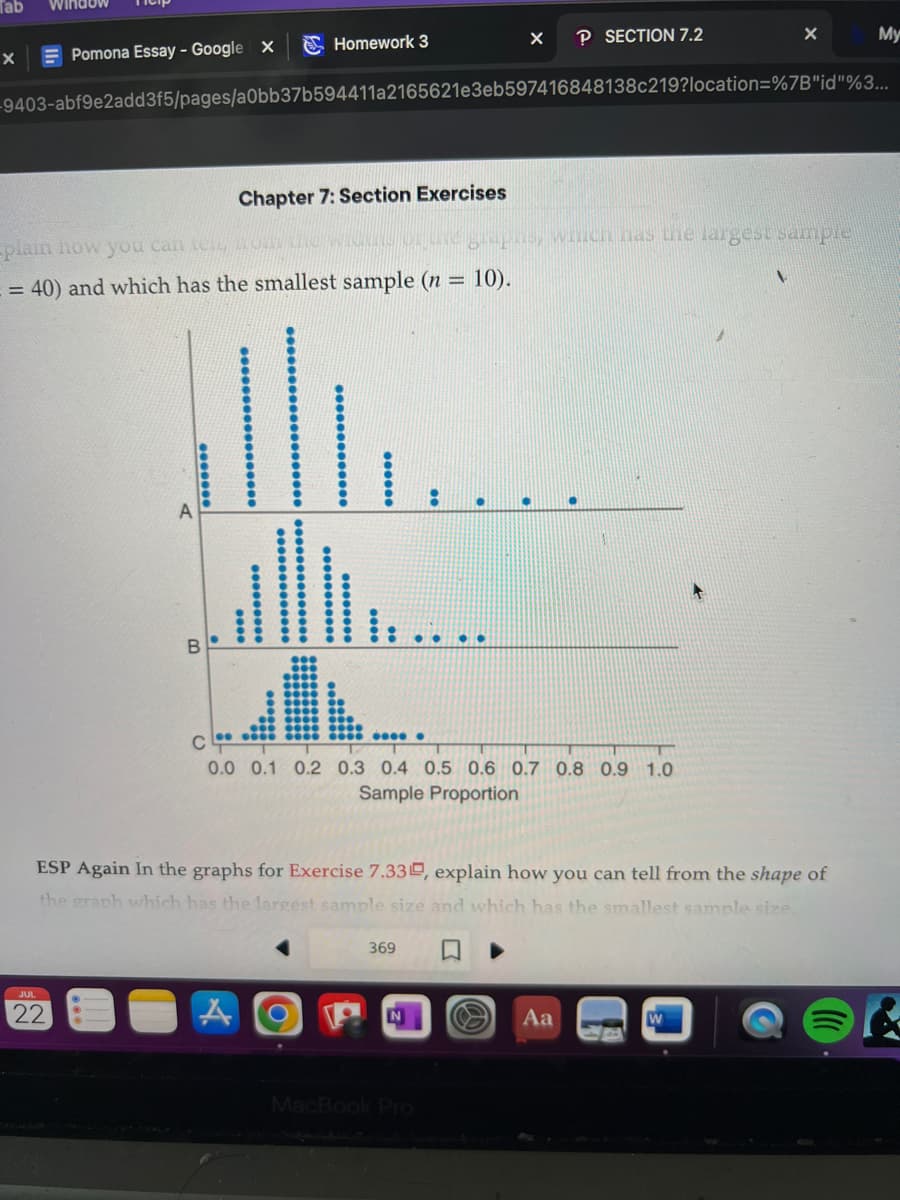
-plain how you can tell R
= 40) and which has the smallest sample (n = 10).
*******
Chapter 7: Section Exercises
ALL..
****
A
********
******
**** ●
C
0.0 0.1 0.2 0.3 0.4 0.5 0.6 0.7 0.8 0.9 1.0
Sample Proportion
369
ESP Again In the graphs for Exercise 7.33, explain how you can tell from the shape of
the graph which has the largest sample size and which has the smallest sample size.
PN
P SECTION 7.2
graphs, which has the largest sample
..
MacBook Pro
X
Aa
My
Expert Solution
This question has been solved!
Explore an expertly crafted, step-by-step solution for a thorough understanding of key concepts.

Step by step
Solved in 2 steps

Recommended textbooks for you
Holt Mcdougal Larson Pre-algebra: Student Edition…
Algebra
ISBN:
9780547587776
Author:
HOLT MCDOUGAL
Publisher:
HOLT MCDOUGAL

College Algebra (MindTap Course List)
Algebra
ISBN:
9781305652231
Author:
R. David Gustafson, Jeff Hughes
Publisher:
Cengage Learning

Holt Mcdougal Larson Pre-algebra: Student Edition…
Algebra
ISBN:
9780547587776
Author:
HOLT MCDOUGAL
Publisher:
HOLT MCDOUGAL
College Algebra (MindTap Course List)
Algebra
ISBN:
9781305652231
Author:
R. David Gustafson, Jeff Hughes
Publisher:
Cengage Learning