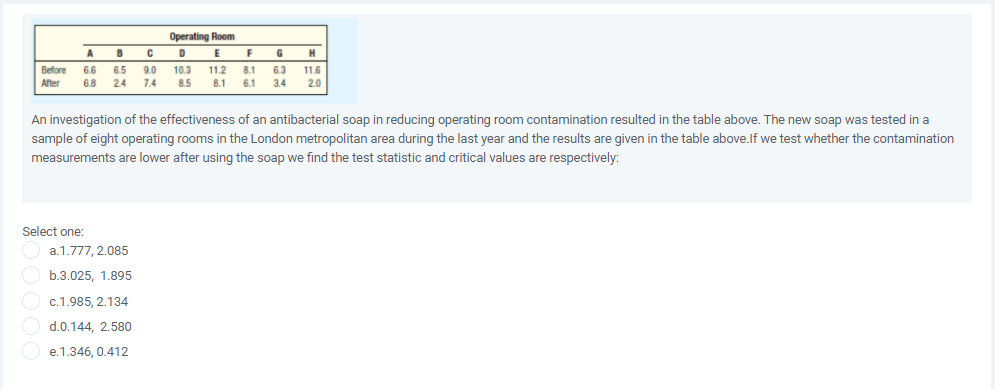
An investigation of the effectiveness of an antibacterial soap in reducing operating room contamination resulted in the table above. The new soap was tested in a sample of eight operating rooms in the London metropolitan area during the last year and the results are given in the table above.lf we test whether the contamination measurements are lower after using the soap we find the test statistic and critical values are respectively:


Q: The population Pearson correlation coefficient between the amount of time girls spend playing video…
A: Given Information: Sample size (n) = 52 Significance level α = 0.05 r=-0.52 To determine whether the…
Q: You ran an experiment investigating the caloric content of Cheerios and Honey Nut Cheerios. The data…
A:
Q: 7. A researcher reports an F-ratio with df = 3, 24 from flos an independent-measures research study.…
A: A researcher reports an F-ratio with df = 3, 24 from an independent-measures research study. Given…
Q: Z-test for a single population mean was performed for single population mean was performed at…
A: Given: α=0.05H0:μ=50
Q: An experiment was conducted to determine whether there is a significant difference among the mean…
A: Given, A B C D E 15 21 22 10 6 18 13 19 14 11 9 20 24 21 15 16 17 21 13 8
Q: A sample of students attending a large university has been selected. Is there a statistically…
A: Given: The researcher wants to know whether there is a significant difference between the Liberal…
Q: A professor randomly selects a sample of 16 students to attend additional statistics tutoring…
A: Note- Solving question number 41 only. Given information- Population mean, μ = 20 Sample size, n =…
Q: You measured 0.0899 ± .0008 µg/mL, also with 7 samples [0.092, 0.089, 0.097, 0.808, 0.091, 0.082,…
A: Given information: The data represents the 8 measurements of level-1 and level-2. The data is as…
Q: Unfortunately, arsenic occurs naturally in some ground watert. A mean arsenic level of u = 8.0 parts…
A:
Q: The data found below measure the amounts of greenhouse gas emissions from three types of vehicles.…
A:
Q: Unfortunately, arsenic occurs naturally in some ground water. A mean arsenic level of mu equals 8.0…
A: Part (a): Level of significance:In the given information, it is said that “Alpha = 0.01”. Now,…
Q: Unfortunately, arsenic occurs naturally in some ground watert. A mean arsenic level of u = 8.0 parts…
A:
Q: Miller and Vanhoutte (A1) conducted experiments in which adult ovariectomized female mongrel dogs…
A: State the hypotheses.
Q: Unfortunately, arsenic occurs naturally in some ground watert. A mean arsenic level of u8.0 parts…
A: a) Denote μ as the average arsenic level.
Q: Thousands of motorists travel on Highway 27 everyday. Before installation of traffic cameras at…
A: Given test statistic is 10.32 critical value=1.96 Decision Rule: If test statistic greater than the…
Q: You are conducting a study to see if the proportion of women over 40 who regularly have mammograms…
A: Concept of p-value: The p-value in hypothesis testing is the probability of obtaining a test…
Q: Environmental Health Much discussion has taken place concerning possible health hazards from…
A: given that,possible chances (x)=7size(n)=525success rate ( p )= x/n = 0.0133point of estimate =…
Q: allowance for zinc among males older than age 50 years is 15 mg/day. An article reports the…
A: Let μ and σ denote respectively the mean and standard deviation of daily zinc intake in the…
Q: Using 0.05 level of significance and assuming that the data is normally distributed: • Tell whether…
A: Solution: let x=Systolic blood pressure before the treatment and y = Systolic blood pressure after…
Q: The data found below measure the amounts of greenhouse gas emissions from three types of vehicles.…
A: Here it is given that the data found below measure the amounts of greenhouse gas emissions from…
Q: A random sample of n, = 10 regions in New England gave the following violent crime rates (per…
A:
Q: What are the independent and dependent variables?
A: Dependent variable: The changes in the independent variable reflects in the dependent variable. It…
Q: A researcher evaluated the effectiveness of relaxation training in reducing anxiety. One sample of…
A: Note: Hey there! Thank you for the question. As you have posted a question with multiple sub-parts,…
Q: Sulfur compounds cause "off‑odors" in wine, so winemakers want to know the odor threshold, the…
A: Given data set is,30, 30, 42, 35, 22, 33, 31, 29, 19, 23Sample size (n) = 10
Q: Almost all medical schools in the United States require students to take the Medical College…
A: Given data, μ=500σ=10.6
Q: 6. Earthquake intensities are measured using a device called a seismograph, which is designed to be…
A:
Q: (c) Use the data in part (a) to estimate p, the proportion of all houses that used at least 100…
A: Solution Given That, A random sample of 10 houses in a particular area, each of which is heated with…
Q: II. For each of the following experiments you should identify the variable(s) in the study, the data…
A: “Since you have posted a question with multiple sub-parts, we will solve first three subparts for…
Q: General Social Survey asked the question, "After an average work day, about how many hours do you…
A: According to guidelines we solve first three subparts when given multiple subparts.
Q: Manova test A therapist interested in helping individuals with Ophidiophobia. In order to do this…
A: MANOVA
Q: You are trying to collect 6 rare photocards from a foreign album. Calculate the average number of…
A: Given information: Trial 1 Trial 2 Trial 3 1 3 5 3 3 5 4 2 4 3 1 3 2 4 4 1 2 1 2 3…
Q: The data found below measure the amounts of greenhouse gas emissions from three types of vehicles.…
A:
Q: The data found below measure the amounts of greenhouse gas emissions from three types of vehicles.…
A: Consider that, µ1, µ2, and µ3 define the true mean amount of green hour gas emission from Type 1, 2…
Q: The data found below measure the amounts of greenhouse gas emissions from three types of vehicles.…
A: The question is based on a one way - ANOVA Given :
Q: e ascorbic acid concentration of five different brands of orange juice was measured. Six replicate…
A:
Q: An investigation of the effectiveness of an antibacterial soap in reducing operating room…
A:
Q: An ANOVA is run on the data pictured in the graph below. Each group had 20 subjects in it, and…
A:
Q: test scores with summaries shown below. Sample Mean = X = 75.2 and Sample SD = S = 15 Estimate the…
A: Given that : Sample size (n) = 25 Sample mean = 75.2 S= 15 C = 0.95 Using confidence interval…
Q: BONUS: Explain (with examples if possible) the relationship between the p-value, alpha, your…
A: Relationship between p-value and alpha: P-value: the probability value is the probability obtains…
Q: You are conducting a study to see if the average male life expectancy is significantly different…
A: The test statistic is -2.75.
Q: Unfortunately, arsenic occurs naturally in some ground watert. A mean arsenic level of u= 8.0 parts…
A: Given that Mean arsenic level (μ) = 8.0 Random sample size (n) = 41 Sample mean (x¯) = 6.9 Sample…
Q: A population has a mean of µ = 20. A sample is selected from this population and a treatment is…
A:
Q: A process is monitored for defective items by taking a sample of 200 items each day and calculating…
A:
Q: (a) What proportion of students taking the MCAT had a score over 518518 ? Compute the proportion and…
A: Let , X→N(μ=500 , σ=10.6) Our aim is to find the following : (a) What proportion of students…
Q: The fill volume of soft-drink beverage bottles is an important quality characteristic. The volume is…
A: The formula for control limits of X bar and r chart is, Control limits for X bar and S chart…
Q: trols per case were chosen for analysis. The following results were observed. Serum Level of Vitamin…
A:
Q: 30 Receive Medication Subjects Randomly Assigned Compare Symptom 30 Receive Placebo of the following…
A: A controlled experiment is a procedure that plans the experiment, conducts, analyzes, and interprets…
Q: An analysis was conducted by the Statistics Consulting Center at Virginia Polytechnic Institute and…
A: Null Hypothesis: The concentration of Garlon has noimpact on the height of the shoots. Alternative…
Q: . Using the Pearson correlation coefficient, a study on addiction found a positive correlation…
A: 25.
Q: A normal population has mean u = 50 and standard deviation o = 5. What is the 80th percentile of the…
A: Let Z be the random variable from normal distribution with mean (μ) = 50 and standard deviation (σ)…


Trending now
This is a popular solution!

Step by step
Solved in 2 steps with 1 images


- You are interested in enhancing the performance of runners in a 10-kilometer event. You randomly select 40 runners and randomly assign them to one of two diet groups. During the 24 hours prior to the 10K run you feed the experimental group a special diet of 80% of their calories from carbohydrates and ad lib water intake. During the 24 hours prior to the event you tell the control group to eat what they normally would eat and drink prior to a 10-K race. Prior to running the event you measure the glycogen content of the quadriceps muscle in mg/kilogram of wet muscle of each subject. You also measure the individual’s time to run the 10K event. Thus, the purpose of your study is to determine the effect of a high carbohydrate diet on glycogen content of the muscle and 10k performance. A secondary purpose is to examine the relationships between glycogen content of the quadriceps and 10K performance. Restate the purpose(s) and formulate Research Hypotheses to address the purposeYou are interested in enhancing the performance of runners in a 10-kilometer event. You randomly select 40 runners and randomly assign them to one of two diet groups. During the 24 hours prior to the 10K run you feed the experimental group a special diet of 80% of their calories from carbohydrates and ad lib water intake. During the 24 hours prior to the event you tell the control group to eat what they normally would eat and drink prior to a 10-K race. Prior to running the event you measure the glycogen content of the quadriceps muscle in mg/kilogram of wet muscle of each subject. You also measure the individual’s time to run the 10K event. Thus, the purpose of your study is to determine the effect of a high carbohydrate diet on glycogen content of the muscle and 10k performance. A secondary purpose is to examine the relationships between glycogen content of the quadriceps and 10K performance. Calculate the appropriate statistic to determine if Ho is rejected or accepted and…You are interested in enhancing the performance of runners in a 10-kilometer event. You randomly select 40 runners and randomly assign them to one of two diet groups. During the 24 hours prior to the 10K run you feed the experimental group a special diet of 80% of their calories from carbohydrates and ad lib water intake. During the 24 hours prior to the event you tell the control group to eat what they normally would eat and drink prior to a 10-K race. Prior to running the event you measure the glycogen content of the quadriceps muscle in mg/kilogram of wet muscle of each subject. You also measure the individual’s time to run the 10K event. Thus, the purpose of your study is to determine the effect of a high carbohydrate diet on glycogen content of the muscle and 10k performance. A secondary purpose is to examine the relationships between glycogen content of the quadriceps and 10K performance. For each statistical hypothesis set indicate the type of question (Descriptive,…
- Life-saving drug: Penicillin is produced by the Penicillin fungus, which is grown in a broth whose sugar content must be carefully controlled. Several samples of broth were taken on three successive days, and the amount of dissolved sugars, in milligrams per milliliter, was measured on each sample. The results were as follows. Day 1: 5.2 5.0 5.4 5.2 5.3 5.0 4.9 5.0 5.2 5.0 4.6 5.3 Day 2: 5.6 4.8 4.9 5.3 5.2 4.9 5.4 5.0 5.4 4.9 5.5 5.4 Day 3: 5.9 4.9 5.3 5.4 5.2 5.5 5.0 5.8 5.5 5.4 5.4 5.1 Construct an ANOVA table. Round your answers to four decimal places as needed. One-way ANOVA: Sugar Concentration Source DF SS MS F P Days Error TotalA farmer has decided to use a new additive to grow his crops. He divided his farm into 10 plots and kept records of the corn yield (in bushels) before and after using the additive. The results are shown below. Plot 1 2 3 4 5 6 7 8 9 10 Before 9 9 8 7 6 8 5 9 10 11 After 10 9 9 8 7 10 6 10 10 12 You wish to test the following hypothesis at the 5 percent level of significance. H0:Population mean d=0 against h1:population mean d <0 What is your decision about H0Winter visitors are extremely important to the economy of Southwest Florida. Hoteloccupancy is an often-reported measure of visitor volume and visitor activity (naplesdaily news, March 22, 2012). Hotel occupancy data for February in two consecutiveyears are as follows.OccupancyCurrent Year Previous YearOccupied Rooms 1470 1458Total Rooms 1750 1800a. Formulate the hypothesis test that can be used to determine if there has been anincrease in the proportion of rooms occupied over the one-year period.b. What is the estimated proportion of hotel rooms occupied each year?c. Using a .05 level of significance, what is your hypothesis test conclusion? What is thep-value?d. What is the 95% confidence interval estimate of the change in occupancy for the oneyear period? Do you think area officials would be pleased with the results?
- 1. An automobile manufacturing company wanted to investigate how the price of one of it's car models depreciates with age. The research department at the company took a sample of 8 cars of this model and collected the following information on the ages (x, in years) and prices (y, in hundreds of pesos) of these cars as shown: Age, x83792546 Price, y18955524140403899 Find the estimated price of a 15 year old car2h. How long it takes paint to dry can have an impact on the production capacity of a business. An auto body & paint business invested in a paint-drying robot to speed up its process. An interesting question is, "Do all paint-drying robots have the same drying time?" To test this, suppose we sample five drying times for each of different brands of paint-drying robots. The time in minutes until the paint was dry enough for a second coat to be applied was recorded. Suppose the following data were obtained. Robot 1 Robot 2 Robot 3 Robot 4 127 145 134 149 137 133 144 141 135 143 137 136 125 146 137 141 141 128 128 153 Find the value of the test statistic. (Round your answer to two decimal places.) Find the p-value. (Round your answer to four decimal places.) p-value =The federal government recently granted funds for a special program designed to reduce crime in high-crime areas. A study of the results of the program in eight high-crime areas of Miami, Florida, yielded the following results. Number of Crimes by Area A B C D E F G H Before 14 7 4 5 17 12 8 9 After 2 7 3 6 8 13 3 5 Has there been a decrease in the number of crimes since the inauguration of the program? Use the 0.01 significance level. Estimate the p-value. Compute the value of the test statistic. (Round your answer to 2 decimal places.)
- The federal government recently granted funds for a special program designed to reduce crime in high-crime areas. A study of the results of the program in eight high-crime areas of Miami, Florida, yielded the following results. Number of Crimes by Area A B C D E F G H Before 14 7 4 5 17 12 8 9 After 2 7 3 6 8 13 3 5 Has there been a decrease in the number of crimes since the inauguration of the program? Use the 0.01 significance level. Estimate the p-value. 1.Compute the value of the test statistic. (Round your answer to 2 decimal places.) 2.What is your decision regarding H0? 23 multiple choice 1 Reject H0 Do not reject H0 34. The p-value is multiple choice: between 0.01 and 0.05 between 0.05 and 0.1 between 0.005 and 0.01 between 0.025 and 0.05I II III n = 5 n = 5 n = 5 M = 1 M = 5 M = 6 N = 15 T = 5 T = 25 T = 30 G = 60 s² = 9.00 s² = 10.00 s² = 11.00 ∑X² = 430 SS = 36 SS = 40 SS = 44 Use an ANOVA with α = .05 to determine whether there are any significant differences among the three treatment means. Source SS df MS F Fcriticalcritical Between treatments Within treatments Total F Distribution Numerator Degrees of Freedom = 6 Denominator Degrees of Freedom = 16 0.01.02.03.04.05.06.07.08.09.010.011.012.0F Conclusion: Reject the null hypothesis; there are no significant differences among the three treatments. Fail to reject the null hypothesis; there are no significant differences among the three treatments. Reject the null hypothesis; there are significant differences among the three treatments. Fail to reject the null hypothesis; there are significant…I II III n = 5 n = 5 n = 5 M = 1 M = 5 M = 6 N = 15 T = 5 T = 25 T = 30 G = 60 s² = 9.00 s² = 10.00 s² = 11.00 ∑X² = 430 SS = 36 SS = 40 SS = 44 Use an ANOVA with α = .05 to determine whether there are any significant differences among the three treatment means. Source SS df MS F Fcriticalcritical Between treatments Within treatments Total F Distribution Numerator Degrees of Freedom = 6 Denominator Degrees of Freedom = 16 0.01.02.03.04.05.06.07.08.09.010.011.012.0F Conclusion: Reject the null hypothesis; there are no significant differences among the three treatments. Fail to reject the null hypothesis; there are no significant differences among the three treatments. Reject the null hypothesis; there are significant differences among the three treatments. Fail to reject the null hypothesis; there are significant…