An investigator analyzed the leading digits from 771 checks issued by seven suspect companies. The frequencies were found to be 5, 10, 0, 61, 320, 322, 5, 17, and 31, and those digits correspond to the leading digits of 1, 2, 3, 4, 5, 6, 7, 8, and 9, respectively. If the observed frequencies are substantially different from the frequencies expected with Benford's law shown below, the check amounts appear to result from fraud. Use a 0.01 significance level to test for goodness-of-fit with Benford's law. Does it appear that the checks are the result of fraud? Leading Digit Actual Frequency Benford's Law: Distribution of Leading Digits 21 10 17.6% 61 9.7% 320 7.9% 322 6.7% 17 30.1% 31 4.6% 12.5% 5.8% 5.1% Determine the null and alternative hypotheses. Ho Calc The leading digits are from a population that conforms to Benford's law. Al least two leading digits have frequencies that do not conform to Benford's law. Calc At most three leading digits have frequencies that do not conform to Benford's law. P-va State At least one leading digit has a frequency that does not conform to Benford's law. V Họ. There V sufficient evidence to warrant rejection of the claim that the leading digits are from a population with a distribution that conforms to Benford's law. it V that the checks are the result of fraud.
An investigator analyzed the leading digits from 771 checks issued by seven suspect companies. The frequencies were found to be 5, 10, 0, 61, 320, 322, 5, 17, and 31, and those digits correspond to the leading digits of 1, 2, 3, 4, 5, 6, 7, 8, and 9, respectively. If the observed frequencies are substantially different from the frequencies expected with Benford's law shown below, the check amounts appear to result from fraud. Use a 0.01 significance level to test for goodness-of-fit with Benford's law. Does it appear that the checks are the result of fraud? Leading Digit Actual Frequency Benford's Law: Distribution of Leading Digits 21 10 17.6% 61 9.7% 320 7.9% 322 6.7% 17 30.1% 31 4.6% 12.5% 5.8% 5.1% Determine the null and alternative hypotheses. Ho Calc The leading digits are from a population that conforms to Benford's law. Al least two leading digits have frequencies that do not conform to Benford's law. Calc At most three leading digits have frequencies that do not conform to Benford's law. P-va State At least one leading digit has a frequency that does not conform to Benford's law. V Họ. There V sufficient evidence to warrant rejection of the claim that the leading digits are from a population with a distribution that conforms to Benford's law. it V that the checks are the result of fraud.

Holt Mcdougal Larson Pre-algebra: Student Edition 2012
1st Edition
ISBN:9780547587776
Author:HOLT MCDOUGAL
Publisher:HOLT MCDOUGAL
Chapter11: Data Analysis And Probability
Section: Chapter Questions
Problem 8CR

Related questions
Question
Help I need in An hour thankyou
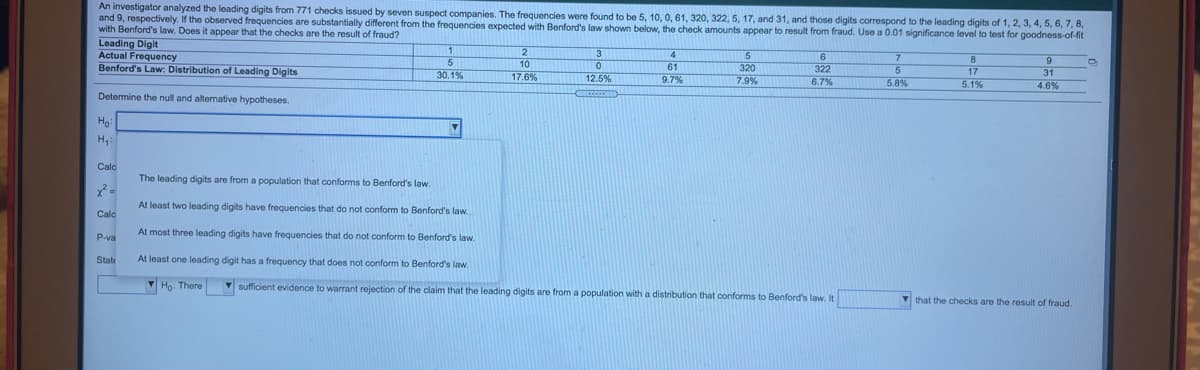
Transcribed Image Text:An investigator analyzed the leading digits from 771 checks issued by seven suspect companies. The frequencies were found to be 5, 10, 0, 61, 320, 322, 5, 17, and 31, and those digits correspond to the leading digits of 1, 2, 3, 4, 5, 6, 7, 8,
and 9, respectively. If the observed frequencies are substantially different from the frequencies expected with Benford's law shown below, the check amounts appear to result from fraud. Use a 0.01 significance level to test for goodness-of-fit
with Benford's law. Does it appear that the checks are the result of fraud?
Leading Digit
Actual Frequency
Benford's Law: Distribution of Leading Digits
4
8.
10
17.6%
61
9.7%
320
7.9%
322
6.7%
17
5.1%
31
4.6%
30.1%
12.5%
5.8%
Determine the null and alternative hypotheses.
Ha
Calo
The leading digits are from a population that conforms to Benford's law.
At least two leading digits have frequencies that do not conform to Benford's law
Calo
At most three leading digits have frequencies that do not conform to Benford's law.
P-va
State
At least one leading digit has a frequency that does not conform to Benford's law.
V Ho. There
V sufficient evidence to warrant rejection of the claim that the leading digits are from a population with a distribution that conforms to Benford's law. It
V that the checks are the result of fraud.
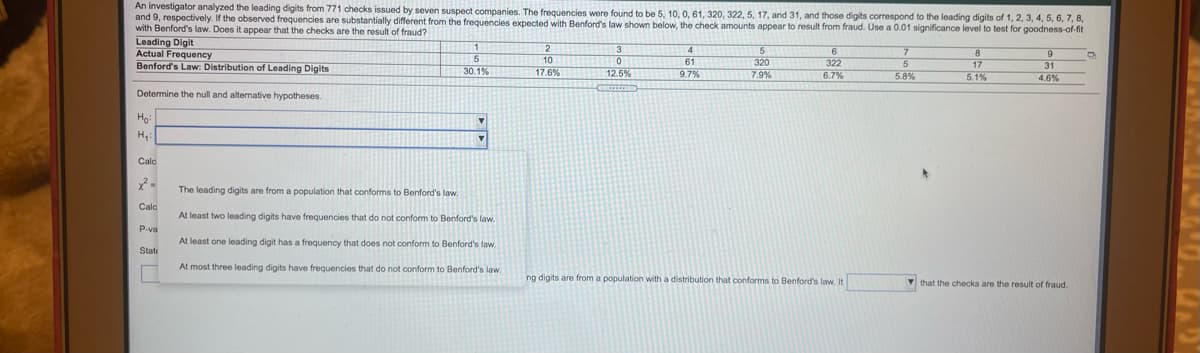
Transcribed Image Text:An investigator analyzed the leading digits from 771 checks issued by seven suspect companies. The frequencies were found to be 5, 10, 0, 61, 320, 322, 5, 17, and 31, and those digits correspond to the leading digits of 1, 2, 3, 4, 5, 6, 7, 8,
and 9, respectively. If the observed frequencies are substantially different from the frequencies expected with Benford's law shown below, the check amounts appear to result from fraud. Use a 0.01 significance level to test for goodness-of-fit
with Benford's law. Does it appear that the checks are the result of fraud?
Leading Digit
Actual Frequency
Benford's Law: Distribution of Leading Digits
3.
4
10
17.6%
322
6.7 %
17
5.1%
61
320
7.9%
31
4.6%
30.1%
12.5%
9.7%
5.8%
Determine the null and alternative hypotheses.
Ho
Calc
The leading digits are from a population that conforms to Benford's law.
Calo
At least two leading digits have frequencies that do not conform to Benford's law.
P-va
At least one leading digit has a frequency that does not conform to Benford's law.
State
At most three leading digits have frequencies that do not conform to Benford's law.
ng digits are from a population with a distribution that conforms to Benford's law. It
V that the checks are the result of fraud.
Expert Solution
This question has been solved!
Explore an expertly crafted, step-by-step solution for a thorough understanding of key concepts.

This is a popular solution!

Trending now
This is a popular solution!

Step by step
Solved in 4 steps

Recommended textbooks for you
Holt Mcdougal Larson Pre-algebra: Student Edition…
Algebra
ISBN:
9780547587776
Author:
HOLT MCDOUGAL
Publisher:
HOLT MCDOUGAL
Holt Mcdougal Larson Pre-algebra: Student Edition…
Algebra
ISBN:
9780547587776
Author:
HOLT MCDOUGAL
Publisher:
HOLT MCDOUGAL