An investigator analyzed the leading digits from 791 checks issued by seven suspect companies. The frequencies were found to be 1, 12, 0, 83, 408, 255, 6, 24, and 2, and those digits correspond to the leading digits of 1, 2, 3, 4, 5, 6, 7, 8, and 9, respectively. If the observed frequencies are substantially different from the frequencies expected with Benford's law shown below, the check amounts appear to result from fraud. Use a 0.10 significance level to test for goodness-of-fit with Benford's law. Does it appear that the checks are the result of fraud? Leading Digit Actual Frequency Benford's Law: Distribution of Leading Digits 9 83 17.6% 408 7.9% 255 6.7% 30.1% 12.5% 9.7% 5.8% 5.1% 4.6% Determine the null and alternative hypotheses. Họ: The leading digits are from a population that conforms to Benford's law. H: At least one leading digit has a frequency that does not conform to Benford's law. Calculate the test statistic, . x= (Round to three decimal places as needed.)
An investigator analyzed the leading digits from 791 checks issued by seven suspect companies. The frequencies were found to be 1, 12, 0, 83, 408, 255, 6, 24, and 2, and those digits correspond to the leading digits of 1, 2, 3, 4, 5, 6, 7, 8, and 9, respectively. If the observed frequencies are substantially different from the frequencies expected with Benford's law shown below, the check amounts appear to result from fraud. Use a 0.10 significance level to test for goodness-of-fit with Benford's law. Does it appear that the checks are the result of fraud? Leading Digit Actual Frequency Benford's Law: Distribution of Leading Digits 9 83 17.6% 408 7.9% 255 6.7% 30.1% 12.5% 9.7% 5.8% 5.1% 4.6% Determine the null and alternative hypotheses. Họ: The leading digits are from a population that conforms to Benford's law. H: At least one leading digit has a frequency that does not conform to Benford's law. Calculate the test statistic, . x= (Round to three decimal places as needed.)

Holt Mcdougal Larson Pre-algebra: Student Edition 2012
1st Edition
ISBN:9780547587776
Author:HOLT MCDOUGAL
Publisher:HOLT MCDOUGAL
Chapter11: Data Analysis And Probability
Section: Chapter Questions
Problem 8CR

Related questions

Question
Calculate the test statistic.
Calculate the p-value.
What is the conclusion of this test?
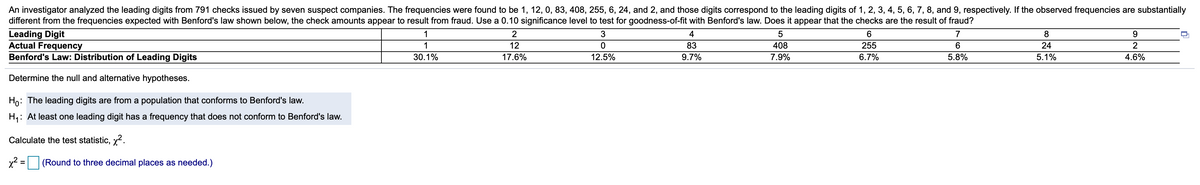
Transcribed Image Text:An investigator analyzed the leading digits from 791 checks issued by seven suspect companies. The frequencies were found to be 1, 12, 0, 83, 408, 255, 6, 24, and 2, and those digits correspond to the leading digits of 1, 2, 3, 4, 5, 6, 7, 8, and 9, respectively. If the observed frequencies are substantially
different from the frequencies expected with Benford's law shown below, the check amounts appear to result from fraud. Use a 0.10 significance level to test for goodness-of-fit with Benford's law. Does it appear that the checks are the result of fraud?
Leading Digit
Actual Frequency
Benford's Law: Distribution of Leading Digits
1
3
4
7
8.
9.
1
12
83
408
255
6.
24
2
30.1%
17.6%
12.5%
9.7%
7.9%
6.7%
5.8%
5.1%
4.6%
Determine the null and alternative hypotheses.
Ho: The leading digits are from a population that conforms to Benford's law.
H4: At least one leading digit has a frequency that does not conform to Benford's law.
Calculate the test statistic, x.
x2 = (Round to three decimal places as needed.)
Expert Solution
This question has been solved!
Explore an expertly crafted, step-by-step solution for a thorough understanding of key concepts.

This is a popular solution!

Trending now
This is a popular solution!

Step by step
Solved in 2 steps with 2 images

Knowledge Booster


Learn more about
Need a deep-dive on the concept behind this application? Look no further. Learn more about this topic, statistics and related others by exploring similar questions and additional content below.Recommended textbooks for you
Holt Mcdougal Larson Pre-algebra: Student Edition…
Algebra
ISBN:
9780547587776
Author:
HOLT MCDOUGAL
Publisher:
HOLT MCDOUGAL
Holt Mcdougal Larson Pre-algebra: Student Edition…
Algebra
ISBN:
9780547587776
Author:
HOLT MCDOUGAL
Publisher:
HOLT MCDOUGAL