An IQ test is an assessment that measures a range of cognitive abilities and provides a score that is intended to serve as a measure of an individual's intellectual poten- tial and ability. The following data set gives a score of IQ test for 40 employees in Company SM. Given the mean of this sample is 63.5 and the standard deviation is 12.33. (a) Determine the value of k. (b) 88.9 k 77.0 76.5 75.9 75.4 75.3 74.2 73.5 72.9 72.4 72.1 70.3 70.1 67.9 67.0 66.6 66.3 65.6 64.3 63.0 61.1 61.0 60.9 60.8 58.9 58.7 58.3 58.2 57.6 55.4 54.8 54.7 54.7 54.7 54.2 53.0 49.3 46.0 14.1 (c) Select a suitable graphing approach for this data and plot the data. Indicate the distribution of the data. Determine the median and mode.
An IQ test is an assessment that measures a range of cognitive abilities and provides a score that is intended to serve as a measure of an individual's intellectual poten- tial and ability. The following data set gives a score of IQ test for 40 employees in Company SM. Given the mean of this sample is 63.5 and the standard deviation is 12.33. (a) Determine the value of k. (b) 88.9 k 77.0 76.5 75.9 75.4 75.3 74.2 73.5 72.9 72.4 72.1 70.3 70.1 67.9 67.0 66.6 66.3 65.6 64.3 63.0 61.1 61.0 60.9 60.8 58.9 58.7 58.3 58.2 57.6 55.4 54.8 54.7 54.7 54.7 54.2 53.0 49.3 46.0 14.1 (c) Select a suitable graphing approach for this data and plot the data. Indicate the distribution of the data. Determine the median and mode.

Glencoe Algebra 1, Student Edition, 9780079039897, 0079039898, 2018
18th Edition
ISBN:9780079039897
Author:Carter
Publisher:Carter
Chapter10: Statistics
Section10.4: Distributions Of Data
Problem 19PFA

Related questions
Question
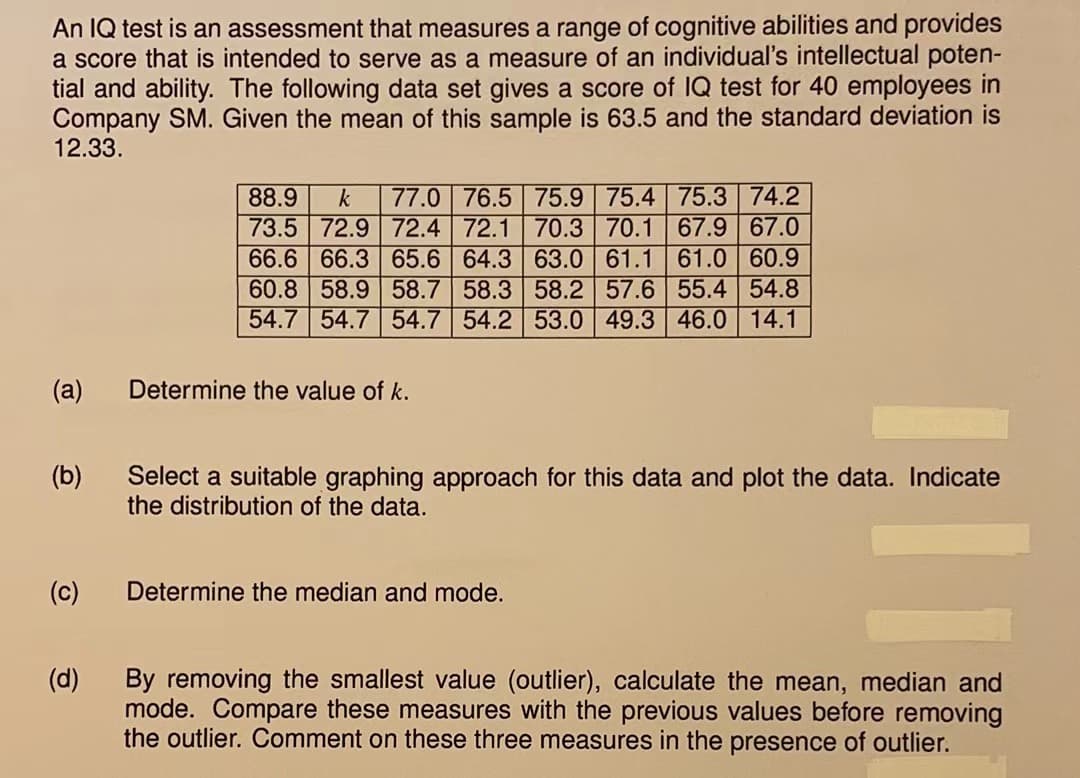
Transcribed Image Text:An IQ test is an assessment that measures a range of cognitive abilities and provides
a score that is intended to serve as a measure of an individual's intellectual poten-
tial and ability. The following data set gives a score of IQ test for 40 employees in
Company SM. Given the mean of this sample is 63.5 and the standard deviation is
12.33.
(a)
(b)
(c)
(d)
88.9 k 77.0 76.5 75.9 75.4 75.3 74.2
73.5 72.9 72.4 72.1 70.3 70.1 67.9 67.0
66.6 66.3 65.6 64.3 63.0 61.1 61.0 60.9
60.8 58.9 58.7 58.3 58.2 57.6 55.4 54.8
54.7 54.7 54.7 54.2 53.0 49.3 46.0 14.1
Determine the value of k.
Select a suitable graphing approach for this data and plot the data. Indicate
the distribution of the data.
Determine the median and mode.
By removing the smallest value (outlier), calculate the mean, median and
mode. Compare these measures with the previous values before removing
the outlier. Comment on these three measures in the presence of outlier.
Expert Solution
This question has been solved!
Explore an expertly crafted, step-by-step solution for a thorough understanding of key concepts.

Step by step
Solved in 4 steps with 2 images

Recommended textbooks for you
Glencoe Algebra 1, Student Edition, 9780079039897…
Algebra
ISBN:
9780079039897
Author:
Carter
Publisher:
McGraw Hill
Glencoe Algebra 1, Student Edition, 9780079039897…
Algebra
ISBN:
9780079039897
Author:
Carter
Publisher:
McGraw Hill