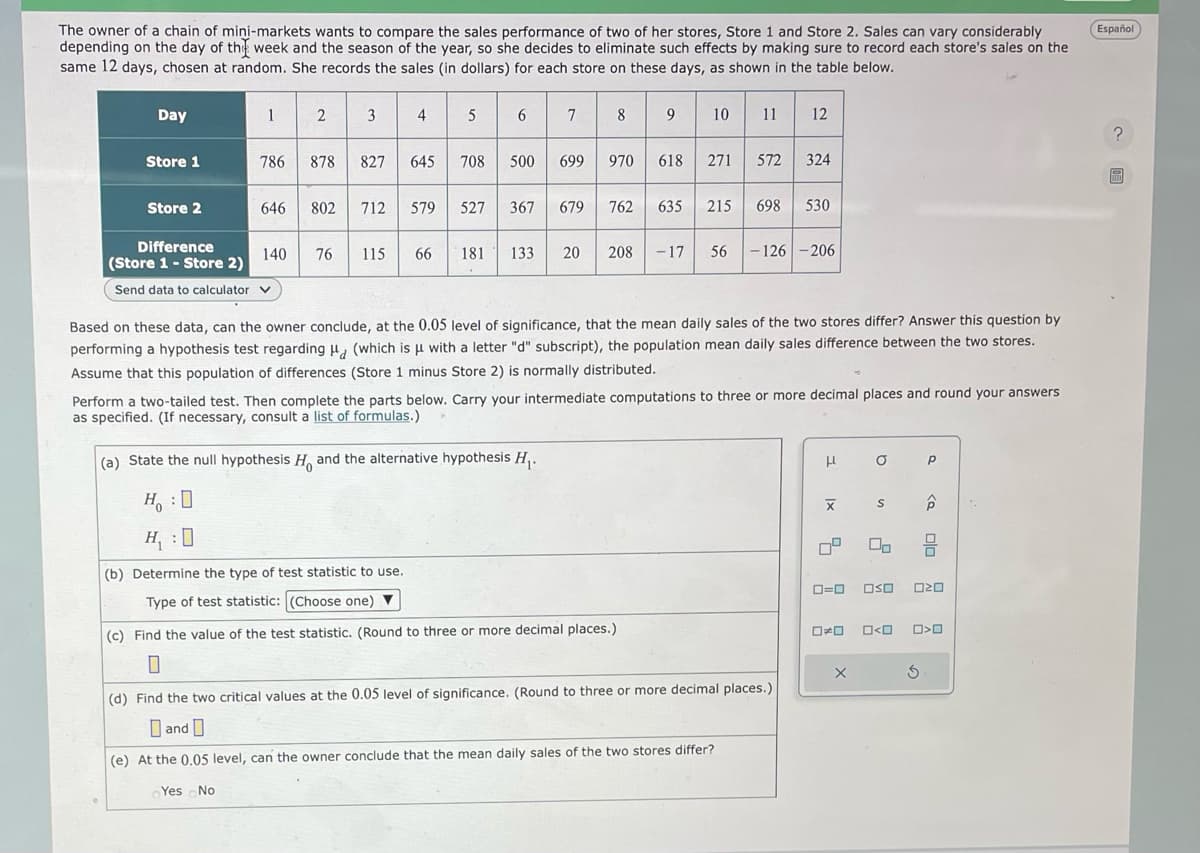
The owner of a chain of mini-markets wants to compare the sales performance of two of her stores, Store 1 and Store 2. Sales can vary considerably depending on the day of the week and the season of the year, so she decides to eliminate such effects by making sure to record each store's sales on the same 12 days, chosen at random. She records the sales (in dollars) for each store on these days, as shown in the table below. Day Store 1 Store 2 1 2 3 786 878 827 Difference (Store 1 - Store 2) Send data to calculator V 4 646 802 712 579 5 645 708 6 7 500 699 527 367 679 8 9 12 970 618 271 572 324 762 635 215 698 530 140 76 115 66 181 133 20 208 -17 56 -126-206 Based on these data, can the owner conclude, at the 0.05 level of significance, that the mean daily sales of the two stores differ? Answer this question by performing a hypothesis test regarding H (which is μ with a letter "d" subscript), the population mean daily sales difference between the two stores. Assume that this population of differences (Store 1 minus Store 2) is normally distributed. Perform a two-tailed test. Then complete the parts below. Carry your intermediate computations to three or more decimal places and round your answers as specified. (If necessary, consult a list of formulas.)
The owner of a chain of mini-markets wants to compare the sales performance of two of her stores, Store 1 and Store 2. Sales can vary considerably depending on the day of the week and the season of the year, so she decides to eliminate such effects by making sure to record each store's sales on the same 12 days, chosen at random. She records the sales (in dollars) for each store on these days, as shown in the table below. Day Store 1 Store 2 1 2 3 786 878 827 Difference (Store 1 - Store 2) Send data to calculator V 4 646 802 712 579 5 645 708 6 7 500 699 527 367 679 8 9 12 970 618 271 572 324 762 635 215 698 530 140 76 115 66 181 133 20 208 -17 56 -126-206 Based on these data, can the owner conclude, at the 0.05 level of significance, that the mean daily sales of the two stores differ? Answer this question by performing a hypothesis test regarding H (which is μ with a letter "d" subscript), the population mean daily sales difference between the two stores. Assume that this population of differences (Store 1 minus Store 2) is normally distributed. Perform a two-tailed test. Then complete the parts below. Carry your intermediate computations to three or more decimal places and round your answers as specified. (If necessary, consult a list of formulas.)
Linear Algebra: A Modern Introduction
4th Edition
ISBN:9781285463247
Author:David Poole
Publisher:David Poole
Chapter2: Systems Of Linear Equations
Section2.4: Applications
Problem 28EQ
Related questions
Question

Transcribed Image Text:The owner of a chain of mini-markets wants to compare the sales performance of two of her stores, Store 1 and Store 2. Sales can vary considerably
depending on the day of the week and the season of the year, so she decides to eliminate such effects by making sure to record each store's sales on the
same 12 days, chosen at random. She records the sales (in dollars) for each store on these days, as shown in the table below.
5 6 7
Day
Store 1
Store 2
1
Difference
(Store 1 - Store 2)
Send data to calculator ✓
2
3
786 878 827 645 708 500 699
140
Yes No
4
646 802 712 579
527
367
76 115 66 181 133
8
(a) State the null hypothesis H and the alternative hypothesis H₁.
H:D
H₁:0
(b) Determine the type of test statistic to use.
Type of test statistic: (Choose one) ▼
970
9 10 11 12
618
679 762 635
271 572 324
215 698 530
Based on these data, can the owner conclude, at the 0.05 level of significance, that the mean daily sales of the two stores differ? Answer this question by
performing a hypothesis test regarding H (which is μ with a letter "d" subscript), the population mean daily sales difference between the two stores.
Assume that this population of differences (Store 1 minus Store 2) is normally distributed.
20 208 -17 56 -126-206
Perform a two-tailed test. Then complete the parts below. Carry your intermediate computations to three or more decimal places and round your answers
as specified. (If necessary, consult a list of formulas.)
(c) Find the value of the test statistic. (Round to three or more decimal places.)
0
(d) Find the two critical values at the 0.05 level of significance. (Round to three or more decimal places.)
and
(e) At the 0.05 level, can the owner conclude that the mean daily sales of the two stores differ?
H
|x
a
S
X
Р
0=0 030 020
olo
0x0 <0 0>0
3
Español
?
D
Expert Solution
This question has been solved!
Explore an expertly crafted, step-by-step solution for a thorough understanding of key concepts.
Step by step
Solved in 5 steps with 2 images

Recommended textbooks for you

Linear Algebra: A Modern Introduction
Algebra
ISBN:
9781285463247
Author:
David Poole
Publisher:
Cengage Learning

Glencoe Algebra 1, Student Edition, 9780079039897…
Algebra
ISBN:
9780079039897
Author:
Carter
Publisher:
McGraw Hill

Holt Mcdougal Larson Pre-algebra: Student Edition…
Algebra
ISBN:
9780547587776
Author:
HOLT MCDOUGAL
Publisher:
HOLT MCDOUGAL

Linear Algebra: A Modern Introduction
Algebra
ISBN:
9781285463247
Author:
David Poole
Publisher:
Cengage Learning

Glencoe Algebra 1, Student Edition, 9780079039897…
Algebra
ISBN:
9780079039897
Author:
Carter
Publisher:
McGraw Hill

Holt Mcdougal Larson Pre-algebra: Student Edition…
Algebra
ISBN:
9780547587776
Author:
HOLT MCDOUGAL
Publisher:
HOLT MCDOUGAL

Algebra & Trigonometry with Analytic Geometry
Algebra
ISBN:
9781133382119
Author:
Swokowski
Publisher:
Cengage
