ANALYSIS II Data Set 2. Imagine the following experiment: A cart is initially at rest. A force pulls the cart through a given distance and gives it an amount of kinetic energy K. At the end of this distance, the force goes to zero and the cart travels with a constant speed. The resulting speed is measured. The data table on the next page shows the measured kinetic energies and the measured speeds. K, Jv, m/s 0.50 0.48 1.50 0.76 3.00 1.10 4.50 1.30 6.00 1.55 7.50 1.70 You wish to determine the relationship between kinetic energy and speed. Speed is the independent variable and kinetic energy is the dependent variable. Enter the data into a graphing calculator or a data analysis program, plot the data and examine the resulting graph. 1. 2. Make a freehand sketch of the resulting graph. Include axes labels (variable names and units) on your sketch. Does the graph show a linear relationship?
ANALYSIS II Data Set 2. Imagine the following experiment: A cart is initially at rest. A force pulls the cart through a given distance and gives it an amount of kinetic energy K. At the end of this distance, the force goes to zero and the cart travels with a constant speed. The resulting speed is measured. The data table on the next page shows the measured kinetic energies and the measured speeds. K, Jv, m/s 0.50 0.48 1.50 0.76 3.00 1.10 4.50 1.30 6.00 1.55 7.50 1.70 You wish to determine the relationship between kinetic energy and speed. Speed is the independent variable and kinetic energy is the dependent variable. Enter the data into a graphing calculator or a data analysis program, plot the data and examine the resulting graph. 1. 2. Make a freehand sketch of the resulting graph. Include axes labels (variable names and units) on your sketch. Does the graph show a linear relationship?

Principles of Physics: A Calculus-Based Text
5th Edition
ISBN:9781133104261
Author:Raymond A. Serway, John W. Jewett
Publisher:Raymond A. Serway, John W. Jewett
Chapter7: Conservation Of Energy
Section: Chapter Questions
Problem 20P: As shown in Figure P7.20, a green bead of mass 25 g slides along a straight wire. The length of the...

Related questions
Question
Transcribed Image Text:ANALYSIS II
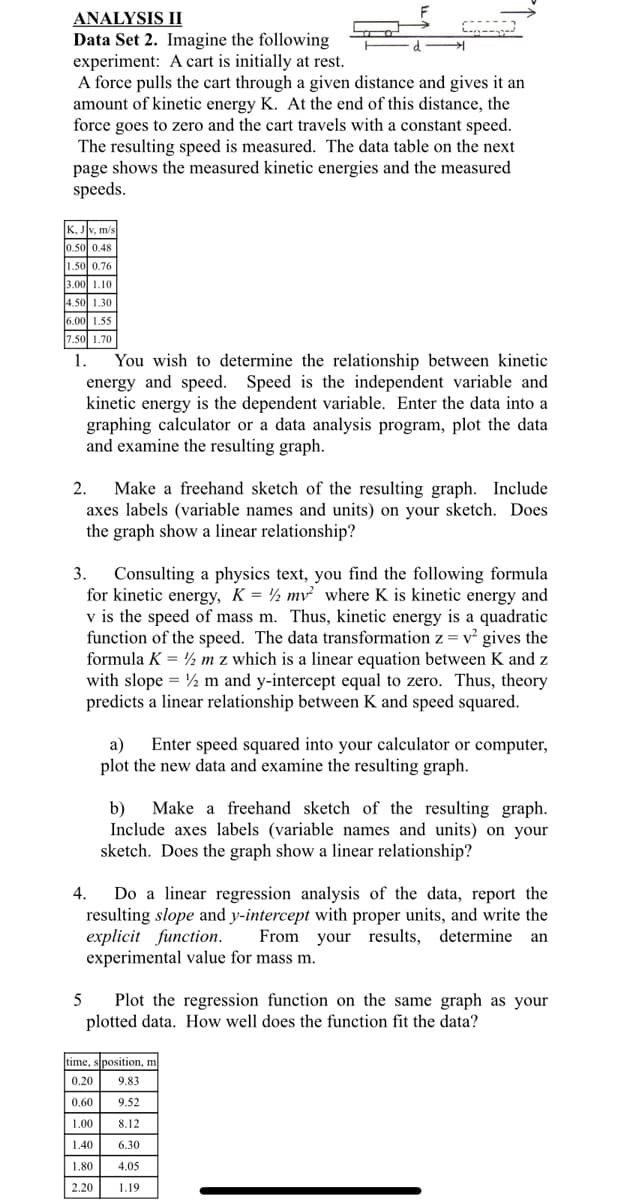
Data Set 2. Imagine the following
experiment: A cart is initially at rest.
A force pulls the cart through a given distance and gives it an
amount of kinetic energy K. At the end of this distance, the
force goes to zero and the cart travels with a constant speed.
The resulting speed is measured. The data table on the next
page shows the measured kinetic energies and the measured
speeds.
K, Jv, m/s
0.50 0.48
1.50 0.76
3.00 1.10
4.50 1.30
6.00 1.55
7.50 1.70
1.
You wish to determine the relationship between kinetic
energy and speed. Speed is the independent variable and
kinetic energy is the dependent variable. Enter the data into a
graphing calculator or a data analysis program, plot the data
and examine the resulting graph.
Make a freehand sketch of the resulting graph. Include
axes labels (variable names and units) on your sketch. Does
the graph show a linear relationship?
2.
Consulting a physics text, you find the following formula
for kinetic energy, K = ½ mv² where K is kinetic energy and
v is the speed of mass m. Thus, kinetic energy is a quadratic
function of the speed. The data transformation z = v² gives the
formula K = ½ m z which is a linear equation between K and z
with slope = ½ m and y-intercept equal to zero. Thus, theory
predicts a linear relationship between K and speed squared.
3.
Enter speed squared into your calculator
plot the new data and examine the resulting graph.
a)
computer,
Make a freehand sketch of the resulting graph.
b)
Include axes labels (variable names and units) on your
sketch. Does the graph show a linear relationship?
Do a linear regression analysis of the data, report the
resulting slope and y-intercept with proper units, and write the
explicit function.
experimental value for mass m.
4.
From your results, determine an
Plot the regression function on the same graph as your
plotted data. How well does the function fit the data?
time, sposition, m
0.20
9.83
0.60
9.52
1.00
8.12
1.40
6.30
1.80
4.05
2.20
1.19
Expert Solution
Step 1
Hi there! Since there are multiple subparts in the question posted and it is not mentioned what is to be answered, we are providing the solution for the first 3 subparts. If the solution for a specified subpart is required please repost the question, specifying the particular subpart. Thank you!

Step by step
Solved in 3 steps with 4 images

Knowledge Booster


Learn more about
Need a deep-dive on the concept behind this application? Look no further. Learn more about this topic, physics and related others by exploring similar questions and additional content below.Recommended textbooks for you
Principles of Physics: A Calculus-Based Text
Physics
ISBN:
9781133104261
Author:
Raymond A. Serway, John W. Jewett
Publisher:
Cengage Learning

Physics for Scientists and Engineers: Foundations…
Physics
ISBN:
9781133939146
Author:
Katz, Debora M.
Publisher:
Cengage Learning

College Physics
Physics
ISBN:
9781305952300
Author:
Raymond A. Serway, Chris Vuille
Publisher:
Cengage Learning
Principles of Physics: A Calculus-Based Text
Physics
ISBN:
9781133104261
Author:
Raymond A. Serway, John W. Jewett
Publisher:
Cengage Learning
Physics for Scientists and Engineers: Foundations…
Physics
ISBN:
9781133939146
Author:
Katz, Debora M.
Publisher:
Cengage Learning
College Physics
Physics
ISBN:
9781305952300
Author:
Raymond A. Serway, Chris Vuille
Publisher:
Cengage Learning

Physics for Scientists and Engineers, Technology …
Physics
ISBN:
9781305116399
Author:
Raymond A. Serway, John W. Jewett
Publisher:
Cengage Learning

College Physics
Physics
ISBN:
9781285737027
Author:
Raymond A. Serway, Chris Vuille
Publisher:
Cengage Learning
