ANC You height data along perčent have the fo Mowing Mowing with their Oeal rrences:

Elementary Geometry For College Students, 7e
7th Edition
ISBN:9781337614085
Author:Alexander, Daniel C.; Koeberlein, Geralyn M.
Publisher:Alexander, Daniel C.; Koeberlein, Geralyn M.
ChapterP: Preliminary Concepts
SectionP.1: Sets And Geometry
Problem 20E: What relationship subset, intersect, disjoint, or equivalent can be used to characterize the two...

Related questions
Question
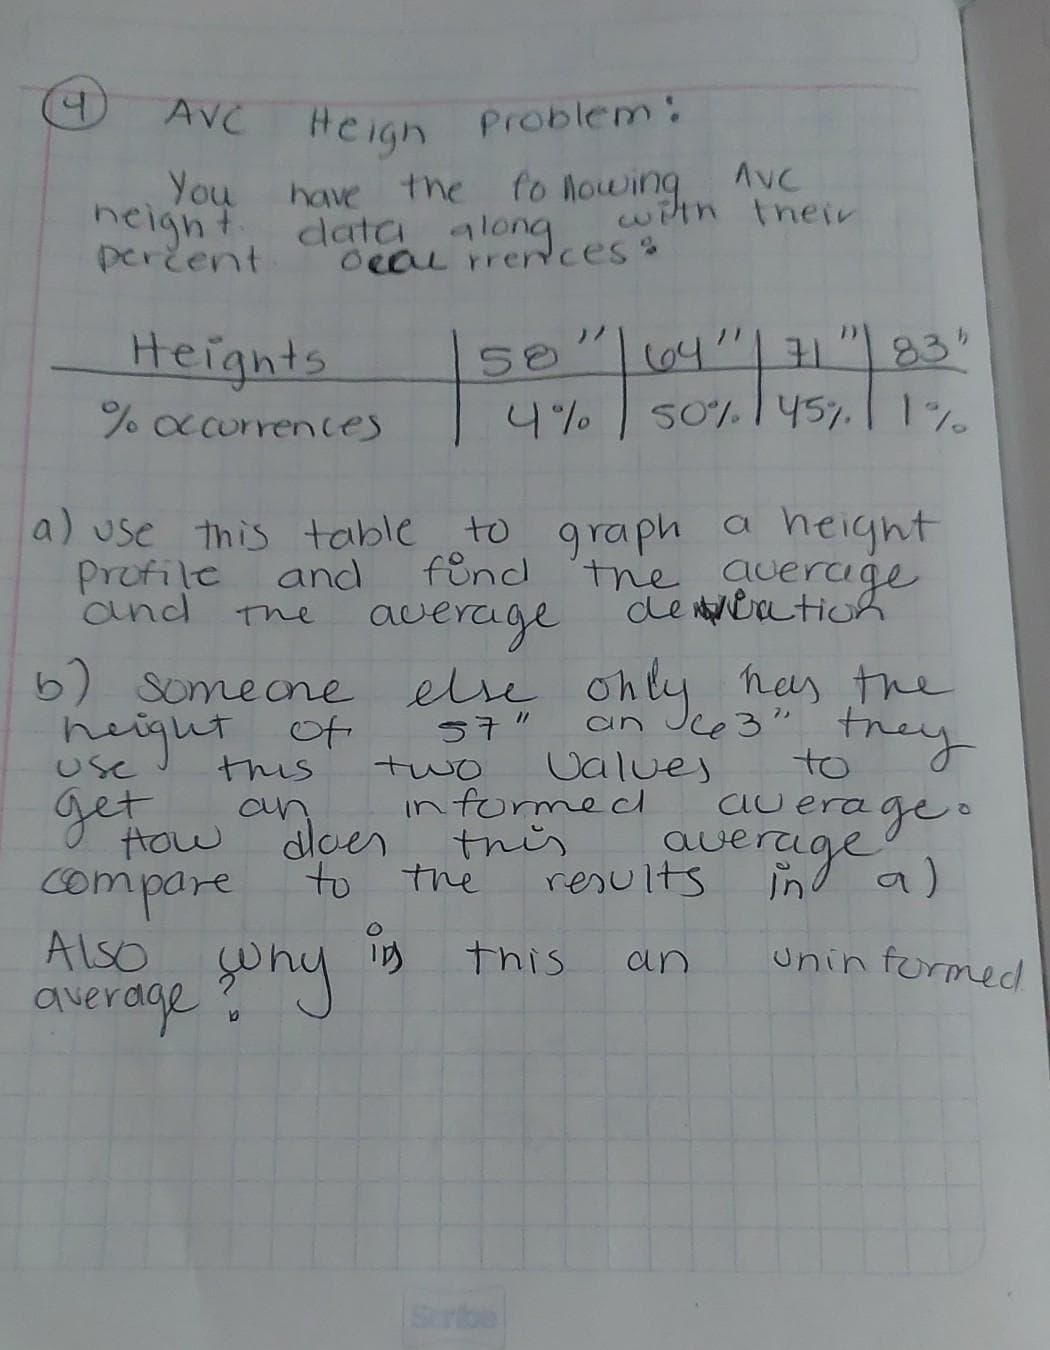
Transcribed Image Text:AVC Heign
Problem:
You
neight
perčent.
have the fo nowing
data along
Oeal rre ces
AVC
with their
Heignts
%acurrences
64"| 71
83"
4%
50% 145%. 1%
a) use this table to graph a height
the auerage
de nbatioh
and
Profile
and
The average
6) someone
else only has the
height of
an Jce3"
to
trey
57"
Use
this
Ualues
two
informecl
this
the
age
ge.
auerage a)
ind
get
au era
How
dloen
compare to
Also
yony
results
this
unin formed
an
average
Scrib
Expert Solution
This question has been solved!
Explore an expertly crafted, step-by-step solution for a thorough understanding of key concepts.

Step by step
Solved in 6 steps with 1 images

Recommended textbooks for you
Elementary Geometry For College Students, 7e
Geometry
ISBN:
9781337614085
Author:
Alexander, Daniel C.; Koeberlein, Geralyn M.
Publisher:
Cengage,

Glencoe Algebra 1, Student Edition, 9780079039897…
Algebra
ISBN:
9780079039897
Author:
Carter
Publisher:
McGraw Hill
Elementary Geometry For College Students, 7e
Geometry
ISBN:
9781337614085
Author:
Alexander, Daniel C.; Koeberlein, Geralyn M.
Publisher:
Cengage,
Glencoe Algebra 1, Student Edition, 9780079039897…
Algebra
ISBN:
9780079039897
Author:
Carter
Publisher:
McGraw Hill