ancial analyst is examining the relationship between stock prices and earnings per share. She chooses fifteen publicly traded companies at random and ords for each the company's current stock price and the company's earnings per share reported for the past 12 months. Her data are given below, with x oting the earnings per share from the previous year and y denoting the current stock price (both in dollars). A scatter plot of her data is shown in Figure 1. Earnings per share, x (in dollars) Current stock price, y (in dollars) 41.07 1.36 37.16 1.44 32.51 0.83 21.34 0.69 28.57 1.53 50.97 1.72 32.12 1.58 41.71 1.99 39.64 1.03 0. 14.06 0.54 58.32 2.70 2.37 Earnings per share (in dollars) 56.90 38.41 1.13 Figure 1 28.89 0.96 0.67 16.27 Send data to calculator Send data to Excel The value of the sample correlation coefficient r for these data is approximately 0.871. Answer the following. Carry your intermediate computations to at least four decimal places, and round your answers as specified below. (If necessary, consult a list of formulas.) (a) What is the value of the slope of the least-squares regression line for these data? Round your answer to at least three decimal places. (b) What is the value of the y-intercept of the least-squares regression line for these data? Current stock price (in dollars)
ancial analyst is examining the relationship between stock prices and earnings per share. She chooses fifteen publicly traded companies at random and ords for each the company's current stock price and the company's earnings per share reported for the past 12 months. Her data are given below, with x oting the earnings per share from the previous year and y denoting the current stock price (both in dollars). A scatter plot of her data is shown in Figure 1. Earnings per share, x (in dollars) Current stock price, y (in dollars) 41.07 1.36 37.16 1.44 32.51 0.83 21.34 0.69 28.57 1.53 50.97 1.72 32.12 1.58 41.71 1.99 39.64 1.03 0. 14.06 0.54 58.32 2.70 2.37 Earnings per share (in dollars) 56.90 38.41 1.13 Figure 1 28.89 0.96 0.67 16.27 Send data to calculator Send data to Excel The value of the sample correlation coefficient r for these data is approximately 0.871. Answer the following. Carry your intermediate computations to at least four decimal places, and round your answers as specified below. (If necessary, consult a list of formulas.) (a) What is the value of the slope of the least-squares regression line for these data? Round your answer to at least three decimal places. (b) What is the value of the y-intercept of the least-squares regression line for these data? Current stock price (in dollars)

Glencoe Algebra 1, Student Edition, 9780079039897, 0079039898, 2018
18th Edition
ISBN:9780079039897
Author:Carter
Publisher:Carter
Chapter4: Equations Of Linear Functions
Section4.5: Correlation And Causation
Problem 2CYU

Related questions
Question
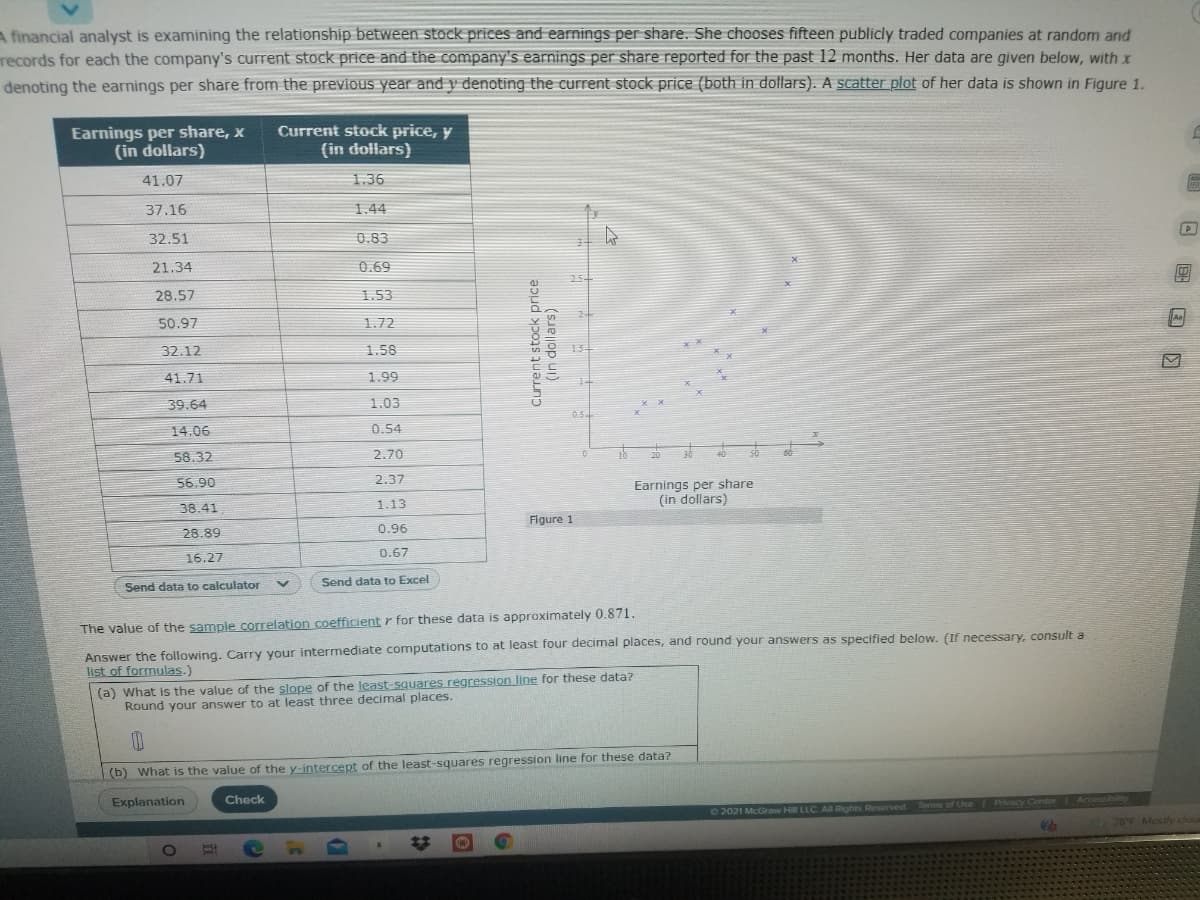
Transcribed Image Text:A financial analyst is examining the relationship between stock prices and earnings per share. She chooses fifteen publicly traded companies at random and
records for each the company's current stock price and the company's earnings per share reported for the past 12 months. Her data are given below, with x
denoting the earnings per share from the previous year and y denoting the current stock price (both in dollars). A scatter plot of her data is shown in Figure 1.
Earnings per share, x
(in dollars)
Current stock price, y
(in dollars)
41.07
1.36
37.16
1.44
32.51
0.83
21.34
0.69
28.57
1.53
50.97
1.72
32.12
1.58
41.71
1.99
39.64
1.03
14.06
0.54
58.32
2.70
2.37
Earnings per share
(in dollars)
56.90
38.41
1.13
Figure 1
28.89
0.96
0.67
16.27
Send data to calculator
Send data to Excel
The value of the sample correlation coefficient r for these data is approximately 0.871.
Answer the following. Carry your intermediate computations to at least four decimal places, and round your answers as specified below. (If necessary, consult a
list of formulas.)
(a) What is the value of the slope of the least-squares regression line for these data?
Round your answer to at least three decimal places.
(b) What is the value of the y-intercept of the least-squares regression line for these data?
Explanation
Check
Pivacy Conter Accessiblity
Terms of Use
02021 McGrow Hi LLC AR Rights Resorved
78F Mostly clou
2:
Current stock price
(in dollars)
回 国国
Transcribed Image Text:38.41
1.13
(in dollars)
28.89
0.96
Figure 1
16.27
0.67
Send data to calculator
Send data to Excel
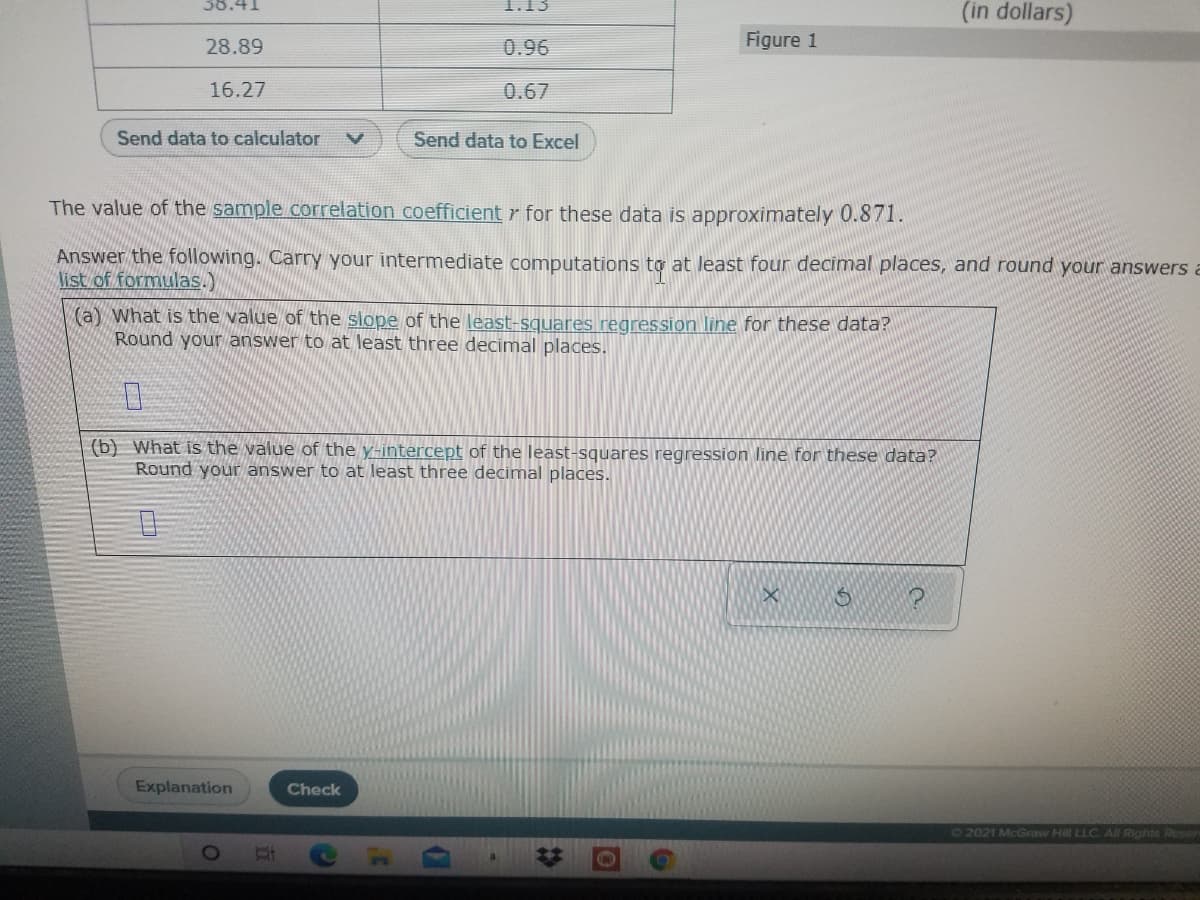
The value of the sample correlation coefficient r for these data is approximately 0.871.
Answer the following. Carry your intermediate computations tợ at least four decimal places, and round your answers a
ist of formulas.)
(a) What is the value of the slope of the least-squares regression line for these data?
Round your answer to at least three decimal places.
(b) What is the value of the y-intercept of the least-squares regression line for these data?
Round your answer to at least three decimal places.
日
Explanation
Check
72021 McGraw Hill LLC AN Rights Res
%23
Expert Solution
This question has been solved!
Explore an expertly crafted, step-by-step solution for a thorough understanding of key concepts.

Step by step
Solved in 2 steps

Recommended textbooks for you
Glencoe Algebra 1, Student Edition, 9780079039897…
Algebra
ISBN:
9780079039897
Author:
Carter
Publisher:
McGraw Hill

Big Ideas Math A Bridge To Success Algebra 1: Stu…
Algebra
ISBN:
9781680331141
Author:
HOUGHTON MIFFLIN HARCOURT
Publisher:
Houghton Mifflin Harcourt

Glencoe Algebra 1, Student Edition, 9780079039897…
Algebra
ISBN:
9780079039897
Author:
Carter
Publisher:
McGraw Hill
Big Ideas Math A Bridge To Success Algebra 1: Stu…
Algebra
ISBN:
9781680331141
Author:
HOUGHTON MIFFLIN HARCOURT
Publisher:
Houghton Mifflin Harcourt

Trigonometry (MindTap Course List)
Trigonometry
ISBN:
9781337278461
Author:
Ron Larson
Publisher:
Cengage Learning

Functions and Change: A Modeling Approach to Coll…
Algebra
ISBN:
9781337111348
Author:
Bruce Crauder, Benny Evans, Alan Noell
Publisher:
Cengage Learning

Holt Mcdougal Larson Pre-algebra: Student Edition…
Algebra
ISBN:
9780547587776
Author:
HOLT MCDOUGAL
Publisher:
HOLT MCDOUGAL