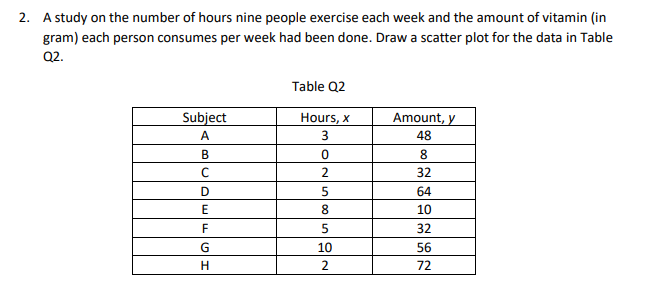
2. A study on the number of hours nine people exercise each week and the amount of vitamin (in gram) each person consumes per week had been done. Draw a scatter plot for the data in Table Q2. Table Q2 Subject Hours, x Amount, y A 3 48 B 8. 2 32 D 64 E 8. 10 F 5 32 G 10 56 H 2 72
2. A study on the number of hours nine people exercise each week and the amount of vitamin (in gram) each person consumes per week had been done. Draw a scatter plot for the data in Table Q2. Table Q2 Subject Hours, x Amount, y A 3 48 B 8. 2 32 D 64 E 8. 10 F 5 32 G 10 56 H 2 72

Glencoe Algebra 1, Student Edition, 9780079039897, 0079039898, 2018
18th Edition
ISBN:9780079039897
Author:Carter
Publisher:Carter
Chapter10: Statistics
Section10.5: Comparing Sets Of Data
Problem 14PPS

Related questions
Question
Transcribed Image Text:2. A study on the number of hours nine people exercise each week and the amount of vitamin (in
gram) each person consumes per week had been done. Draw a scatter plot for the data in Table
Q2.
Table Q2
Subject
Hours, x
Amount, y
A
48
B
8.
32
D
64
8
10
F
32
10
56
72
Expert Solution
This question has been solved!
Explore an expertly crafted, step-by-step solution for a thorough understanding of key concepts.

Step by step
Solved in 2 steps with 1 images

Recommended textbooks for you
Glencoe Algebra 1, Student Edition, 9780079039897…
Algebra
ISBN:
9780079039897
Author:
Carter
Publisher:
McGraw Hill

Holt Mcdougal Larson Pre-algebra: Student Edition…
Algebra
ISBN:
9780547587776
Author:
HOLT MCDOUGAL
Publisher:
HOLT MCDOUGAL
Glencoe Algebra 1, Student Edition, 9780079039897…
Algebra
ISBN:
9780079039897
Author:
Carter
Publisher:
McGraw Hill
Holt Mcdougal Larson Pre-algebra: Student Edition…
Algebra
ISBN:
9780547587776
Author:
HOLT MCDOUGAL
Publisher:
HOLT MCDOUGAL