Annual high temperatures in a certain location have been tracked for several years. Let X represent the year and Y the high temperature. Based on the data shown below, calculate the correlation coefficient (to three decimal places) between X and Y. Use your calculator! y 5 25.72 6 24.19 7 23.86 8 26.33 22.4 10 23.57 11 21.74 12 21.51 13 22.18 14 23.35 15 21.42 16 22.89 17 20.66 18 21.43 19 21.8 r =
Annual high temperatures in a certain location have been tracked for several years. Let X represent the year and Y the high temperature. Based on the data shown below, calculate the correlation coefficient (to three decimal places) between X and Y. Use your calculator! y 5 25.72 6 24.19 7 23.86 8 26.33 22.4 10 23.57 11 21.74 12 21.51 13 22.18 14 23.35 15 21.42 16 22.89 17 20.66 18 21.43 19 21.8 r =

Chapter4: Linear Functions
Section: Chapter Questions
Problem 44RE: For the following exercises, consider this scenario: The population of a city increased steadily...

Related questions
Question
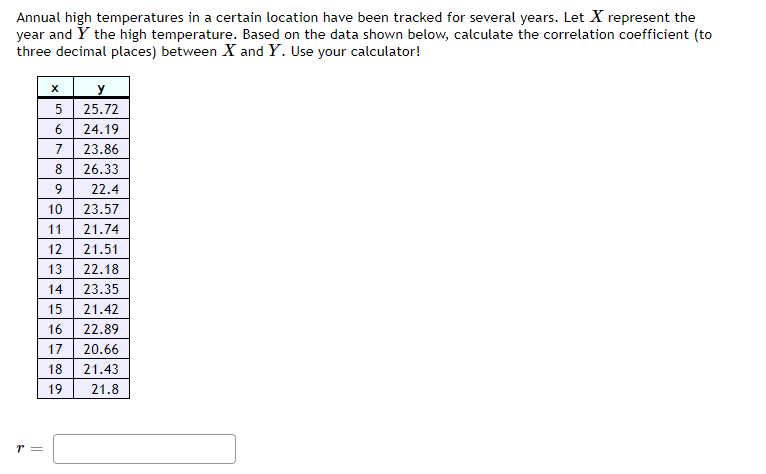
Transcribed Image Text:Annual high temperatures in a certain location have been tracked for several years. Let X represent the
year and Y the high temperature. Based on the data shown below, calculate the correlation coefficient (to
three decimal places) between X and Y. Use your calculator!
y
5 25.72
6
24.19
7
23.86
8
26.33
22.4
10
23.57
11
21.74
12
21.51
13
22.18
14
23.35
15
21.42
16
22.89
17
20.66
18
21.43
19
21.8
r =
Expert Solution
This question has been solved!
Explore an expertly crafted, step-by-step solution for a thorough understanding of key concepts.

This is a popular solution!

Trending now
This is a popular solution!

Step by step
Solved in 3 steps with 3 images

Recommended textbooks for you

Glencoe Algebra 1, Student Edition, 9780079039897…
Algebra
ISBN:
9780079039897
Author:
Carter
Publisher:
McGraw Hill

Big Ideas Math A Bridge To Success Algebra 1: Stu…
Algebra
ISBN:
9781680331141
Author:
HOUGHTON MIFFLIN HARCOURT
Publisher:
Houghton Mifflin Harcourt
Glencoe Algebra 1, Student Edition, 9780079039897…
Algebra
ISBN:
9780079039897
Author:
Carter
Publisher:
McGraw Hill
Big Ideas Math A Bridge To Success Algebra 1: Stu…
Algebra
ISBN:
9781680331141
Author:
HOUGHTON MIFFLIN HARCOURT
Publisher:
Houghton Mifflin Harcourt