Annual high temperatures in a certain location have been tracked for several years. Let X represent the year and Y the high temperature. Based on the data shown below, calculate the correlation coefficient (to three decimal places) between X and Y. y 22.48 20.64 6. 19.8 7 15.26 8. 11.72 9. 8.78 10 6.44 11 3.4 r =
Annual high temperatures in a certain location have been tracked for several years. Let X represent the year and Y the high temperature. Based on the data shown below, calculate the correlation coefficient (to three decimal places) between X and Y. y 22.48 20.64 6. 19.8 7 15.26 8. 11.72 9. 8.78 10 6.44 11 3.4 r =

Chapter6: Exponential And Logarithmic Functions
Section6.8: Fitting Exponential Models To Data
Problem 3TI: Table 6 shows the population, in thousands, of harbor seals in the Wadden Sea over the years 1997 to...

Related questions
Question
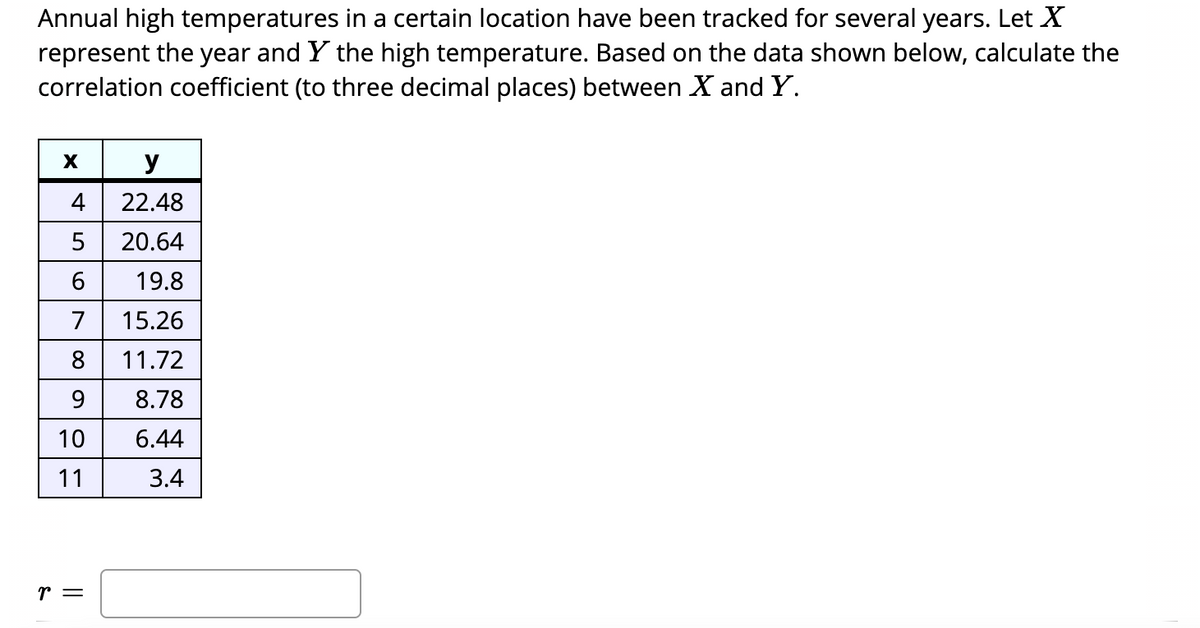
Transcribed Image Text:Annual high temperatures in a certain location have been tracked for several years. Let X
represent the year and Y the high temperature. Based on the data shown below, calculate the
correlation coefficient (to three decimal places) between X and Y.
y
4
22.48
5
20.64
19.8
7
15.26
8
11.72
9.
8.78
10
6.44
11
3.4
r =
Expert Solution
This question has been solved!
Explore an expertly crafted, step-by-step solution for a thorough understanding of key concepts.

Step by step
Solved in 4 steps

Knowledge Booster


Learn more about
Need a deep-dive on the concept behind this application? Look no further. Learn more about this topic, statistics and related others by exploring similar questions and additional content below.Recommended textbooks for you

Functions and Change: A Modeling Approach to Coll…
Algebra
ISBN:
9781337111348
Author:
Bruce Crauder, Benny Evans, Alan Noell
Publisher:
Cengage Learning

Algebra & Trigonometry with Analytic Geometry
Algebra
ISBN:
9781133382119
Author:
Swokowski
Publisher:
Cengage
Functions and Change: A Modeling Approach to Coll…
Algebra
ISBN:
9781337111348
Author:
Bruce Crauder, Benny Evans, Alan Noell
Publisher:
Cengage Learning
Algebra & Trigonometry with Analytic Geometry
Algebra
ISBN:
9781133382119
Author:
Swokowski
Publisher:
Cengage


Trigonometry (MindTap Course List)
Trigonometry
ISBN:
9781337278461
Author:
Ron Larson
Publisher:
Cengage Learning