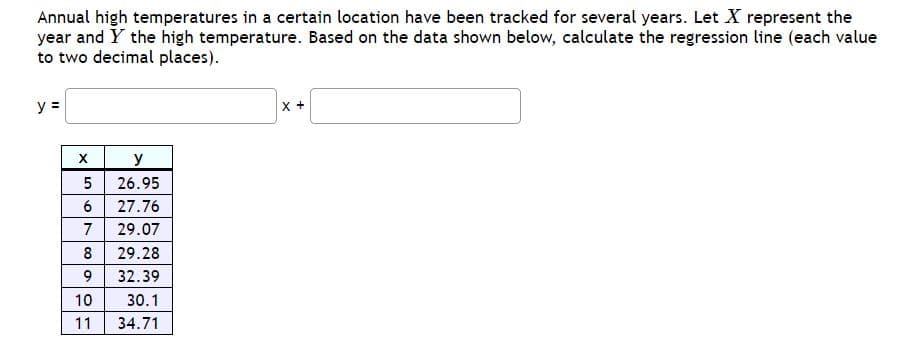
Annual high temperatures in a certain location have been tracked for several years. Let X represent the year and Y the high temperature. Based on the data shown below, calculate the regression line (each value to two decimal places). y = X y 26.95 5 6 27.76 7 29.07 8 9 29.28 32.39 10 30.1 11 34.71 X +


Q: For the above model, determine the following: a. Mean Excess Loss Function b. Limited Expected…
A: In the given question, we are provided with a mathematical model represented by the function F4(x).…
Q: 不 A candy bar manufacturer is interested in trying to estimate how sales are influenced by the price…
A: It is required to estimate the slope for the price and sales data on candy bars.
Q: Identify the type I error and the type II error that corresponds to the given hypothesis. The…
A: A hypothesis test is used to test whether the claim of the hypothesis is rejected or not. It has two…
Q: A survey 144 retail stores revealed that the average price of a ZBox was $375 with a standard error…
A: Sample size n=144Mean Standard error SE=20.
Q: The graph below shows the number of students at Collins Middle School enrolled in Spanish classes…
A: The objective is to identify the correct statement based on the bar graph. The height of each bar…
Q: Consider the mode, median, and mean. Which average represents the most frequent value of a…
A: we have to identify Which average represents the most frequent value of a distribution? mean,median…
Q: Weight (lbs.) 173 184 194 214 168 220 188 188 207 167 217 Systolic Blood Pressure 132 143 153 162…
A: Weight(lbs.)173184194214168220188188207167217Systolic Blood…
Q: At the beginning of the COVID-19 Pandemic, the Department of Health used a graph to represent the…
A: At the beginning of COVID- 19 Pandemic, the department of health used a graph to represent the…
Q: The probability density function for the number of faulty devices by a machine in a particular time…
A: The given probability density function is,Where represents the number of faulty devices…
Q: Consider the data that was obtained from a random sample of 51 credit card accounts. Identify all…
A: Sample size,
Q: Twelve different video games showing violence were observed. The duration times of violence were…
A: Let be the population mean.Given that,
Q: Use the accompanying data set to complete the following actions. a. Find the quartiles. b. Find the…
A: The value of Q1 is obtained below as follows:From the information, given thatThe value of Q2 is…
Q: 5. Assume normal distribution with mean of 0 and standard deviation of 1. Draw a sketch and find the…
A: Here Mean = 0Standard deviation = 1
Q: You believe that your morning commute to UCLA is decreasing every week. You record the time of 7…
A: A statement of no effect or no difference that depicts the status quo or the default assumption that…
Q: Using the built-in dataset cars that is included with R, and by using the parameter estimates…
A: The task at hand involves analyzing the "cars" dataset included with the R programming language. The…
Q: There are many reasons adults use credit cards. A recent survey found that 66% of adults used credit…
A: 66% of adults use credit cards for convenience.Confidence level is 99% i.e., 0.99.Margin of error is…
Q: How to get points in the parameter from,p(-1.00<z<2.00)
A: Find the probabilityP(-1<Z<2)=?
Q: Is the boxplot skewed and does it have any outliers
A: Box plot : Box plot consist 5 number summary : { Minimum,Q1,Q2,Q3, Maximum } GenerallyOutliers…
Q: iven the following characteristics, select the function family that is described. Shape: single…
A: The graphs are used to represent the structure or behaviour of the data present in this. The pattern…
Q: How to detect this violation graphically & statistically? What is the remedy measure for the…
A: Specification bias is a circumstance in which the regression analysis model has been improperly or…
Q: Solve the following problem using MATLAB. Write the syntax and the MATLAB out put on the space…
A: In this problem, we are given the grades of three students in different components: tests, projects,…
Q: Assume that a procedure yields a binomial distribution with n = 333 trials and the probability of…
A: n = 333p = 0.66x~Binomial(n=333,p=0.66)P(X=x)=
Q: 6) The proportions of blood types O, A, B, and AB in the general populations of a particular country…
A: The question is about categorical data analysisGiven :To find :Test the hypo. that the prop. in this…
Q: Many studies have been conducted to test the effects of marijuana use on mental abilities. In one…
A: The significance level, The information regarding Light marijuana users and Heavy marijuana users…
Q: A local county has an unemployment rate of 4.7%. A random sample of 20 employable people are picked…
A: It is given that-Probability that the person is unemployed is :Number of sampled population:
Q: any approach convenient to you An electrical company claims that the lives of the light bulbs it…
A: Note:As per guidelines, we are answering the first question in the case of multiple questions.
Q: Variance: -12 X
A: The probability density function f(x)= over the interval[2,6]A random variable…
Q: Identify the null hypothesis, alternative hypothesis, test statistic, p-value(s), conclusion about…
A: The question is about hypo. testingGiven :No. of babies born using given method ( n ) = 325No. of…
Q: The data show the distance (in miles) from an airport of a sample of 22 inbound and outbound…
A: We are given that…
Q: Including an additional regressor in a regression always leads to more accurate estimates of…
A: The question at hand explores the implications of including an additional regressor in a regression…
Q: A random variable x has the following distribution: X for x = 1, 2, 3 • f(x)=2x-1 69 • Zero…
A: The distribution function of the variable is given as:
Q: Compute E(X).
A: It is given that the random variable X represents the number of batches ordered by a randomly chosen…
Q: A local county has an unemployment rate of 7.2%. A random sample of 18 employable people are picked…
A: It is given that n = 18 and p = 0.072.Hey there! Thank you for posting the question. Since your…
Q: From previous experience, the owner of an apple orchard knows that the mean weight of Gala apples is…
A: It is given that, the owner of an apple orchard knows that the mean weight of Gala apples is 140…
Q: In a survey of students, 60% were in high school and 40% were in middle school. Of the high school…
A: A measure of the likelihood or chance of an event occurring is termed 'probability'. It quantifies…
Q: Which graphs are used for categorical data? Group of answer choices Boxplot Pictogram Histogram Line…
A: The data set, in which the variable is characterized in terms of certain attributes is defined as a…
Q: Problem 3.3 Let X, Y, Z be random variables with finite second moments and suppose that X is to be…
A: In the given question, we are dealing with random variables X, Y, and Z, assuming they have finite…
Q: What is the effect of this violation on the regression model? "The number of observations n is less…
A: Statistical method that estimates the relationship between a dependent variable and one or more…
Q: The number of typing errors on a page follows a Poisson distribution with an average of 0.8 per…
A: The number of typing errors on a page follows a Poisson distribution with an average of 0.8 per…
Q: b) Use the cumulative relative frequency plot from part (a) to answer the following questions.…
A: The data for cumulative frequency is given as- Year survived Frequency0 to < 20.12 to< 40.524…
Q: Eight different dice are rolled and the numbers showing are recorded. How many different outcomes…
A: Eight different dice are rolled
Q: if X is a normal random variable with mean u = 3 and variance 62 = 16, find P(X >3), P(X>-1)
A: Mean=3, variance=16
Q: A simple random sample of 200 names from a list of 3042 names and addresses were investigated and…
A: A sample of 200 names were selected from a list of 3042 names.Out of the 200 samples, 38 had wrong…
Q: The Center for Medicare and Medical Services reported that there were 295,000 appeals for…
A: Hey there! Thank you for posting the question. Since your question has more than 3 parts, we are…
Q: Use the sample data and confidence level given below to complete parts (a) through (d). A research…
A: n=1004x=511and c=0.99
Q: According to a survey, 58% of young Americans aged 18 to 29 say the primary way they watch…
A: As per our guidelines we are supposed to answer only 3 sub-parts.a) To determine the percentage of…
Q: Find the mean of the data summarized in the given frequency distribution. Compare the computed mean…
A: The measure of central tendency that represents the average value of the data is termed the 'mean'…
Q: The display provided from technology available below results from using data for a smartphone…
A: Claim: The population mean is less than 6.00 Mbps.Significance level
Q: Let X and Y be two discrete random variables and f(X) and f(Y) be some functions of X and Y…
A: Variables with discrete randomness can have a finite number of different values. A discrete random…
Q: A fifth grader takes a standardized achievement test (mean = 125, standard deviation = 15) and…
A: Mean()=125standard deviation()=15Scores=148


Trending now
This is a popular solution!

Step by step
Solved in 3 steps with 5 images

- Find the equation of the regression line for the following data set. x 1 2 3 y 0 3 4Olympic Pole Vault The graph in Figure 7 indicates that in recent years the winning Olympic men’s pole vault height has fallen below the value predicted by the regression line in Example 2. This might have occurred because when the pole vault was a new event there was much room for improvement in vaulters’ performances, whereas now even the best training can produce only incremental advances. Let’s see whether concentrating on more recent results gives a better predictor of future records. (a) Use the data in Table 2 (page 176) to complete the table of winning pole vault heights shown in the margin. (Note that we are using x=0 to correspond to the year 1972, where this restricted data set begins.) (b) Find the regression line for the data in part ‚(a). (c) Plot the data and the regression line on the same axes. Does the regression line seem to provide a good model for the data? (d) What does the regression line predict as the winning pole vault height for the 2012 Olympics? Compare this predicted value to the actual 2012 winning height of 5.97 m, as described on page 177. Has this new regression line provided a better prediction than the line in Example 2?Annual high temperatures in a certain location have been tracked for several years. Let XX represent the year and YY the high temperature. Based on the data shown below, calculate the regression line (each value to two decimal places).y = x + x y 2 4.13 3 1.72 4 4.21 5 1.9 6 4.69 7 1.68 8 2.27 9 1.86 10 2.25 11 3.14 12 1.53 13 0.72 14 0.51 15 3.5
- Annual high temperatures in a certain location have been tracked for several years. Let Xrepresent the year and Y the high temperature. Based on the data shown below, calculate the regression line (each value to two decimal places).y = x + x y 4 14.9 5 17 6 18.7 7 23.2 8 23.2 9 28 10 30.8 11 34.4 12 36.3 13 37.5 14 42.6 15 42.9 16 47.4Annual high temperatures in a certain location have been tracked for several years. Let X represent the year and Y the high temperature. Based on the data shown below, calculate the regression line (each value to two decimal places).y = x + x y 5 8.3 6 9.06 7 9.12 8 11.98 9 8.44 10 12.4 11 9.56 12 11.22 13 10.08 14 10.74A set of n = 4 pairs of X and Y values has a Pearson correlation of r = 0.60 and SSY = 200. The standard error of estimate for the regression equation is _______. a. 8 points b. 10 points c. 6 points d. 4 points
- The prelim grades (x) and midterm grades (y) of a sample of 10 MMW students is modeled by the regression line y = 12.0623 + 0.7771x. Estimate the prelim grade if the midterm grade is 83.Find the equation of the regression line for the given data. Then construct a scatter plot of the data and draw the regression line. (Each pair of variables has a significant correlation.) Then use the regression equation to predict the value of y for each of the given x-values, if meaningful. The caloric content and the sodium content (in milligrams) for 6 beef hot dogs are shown in the table below. Calories, x Sodium, y150 410180 460120 320120 36070 290190 540 (a) x=160 calories (b) x=90 calories (c) x=130 calories (d) x=220 calories Y=_____x+(___)Use the given data to find the scatterplot, equation of the regression line, and prediction. x 1.2 1.4 1.6 1.8 2.0 y 54 53 55 54 56 Let α=0.05 Scatterplot from the calculator: What is the linear regression equation? (Round to 3 decimal places) ^ y= _________________________________________________________________ r = _______________ critical value from table: ________________ Is there a strong enough linear correlation to use the regression equation given? ___________ Explain why? _____________________________________________________ What is the best predicted y-value when x=1.9 ? _______________
- For these (x,y) pairs of data points: 1,5 3,7 4,6 5,8 7,9 Compute b1. Compute b0. What is the equation of the regression line?A researcher wants to know if there is a significant correlation between hours spent studying for an exam (X) and exam performance (Y). Level of significance is 0.05, degrees of freedom is 3, and the critical value is 0.878. Interpret the strength and direction of the correlation, calculate and interpret the coefficient of determination, then develop the simple regression equation for the two variables. X (Time Spent Studying in Hours) Y (Exam Performance, 0 to 100) 3 56 6 77 7 79 8 70 11 96 Mean 7.00 75.60 SD 2.92 14.54 For this question, on your hand calculation document clearly state: a) the null hypothesis, b) the alternative hypothesis, c) the alpha level you are using, d) the critical value, e) process for calculating r, f) your decision about the null hypothesis, g) the coefficient of determination, h) and regression equation. This is what I will be marking. You may also enter your responses here, but it is…A set of n = 15 pairs of X and Y values has a correlation of r = +0.80 with SSY = 75, and the regression equation for predicting Y is computed. Find the standard error of estimate for the regression equation. How big would the standard error be if the sample size were n = 30.
