b) Use the cumulative relative frequency plot from part (a) to answer the following questions. (Enter your answers to two decimal places. (i) What is the approximate proportion of patients who lived fewer than 5 years after treatment? (ii) What is the approximate proportion of patients who lived fewer than 7.5 years after treatment? (iii) What is the approximate proportion of patients who lived more than 10 years after treatment?
b) Use the cumulative relative frequency plot from part (a) to answer the following questions. (Enter your answers to two decimal places. (i) What is the approximate proportion of patients who lived fewer than 5 years after treatment? (ii) What is the approximate proportion of patients who lived fewer than 7.5 years after treatment? (iii) What is the approximate proportion of patients who lived more than 10 years after treatment?

Glencoe Algebra 1, Student Edition, 9780079039897, 0079039898, 2018
18th Edition
ISBN:9780079039897
Author:Carter
Publisher:Carter
Chapter4: Equations Of Linear Functions
Section4.4: Scatter Plots And Line Of Fit
Problem 1GP

Related questions
Question
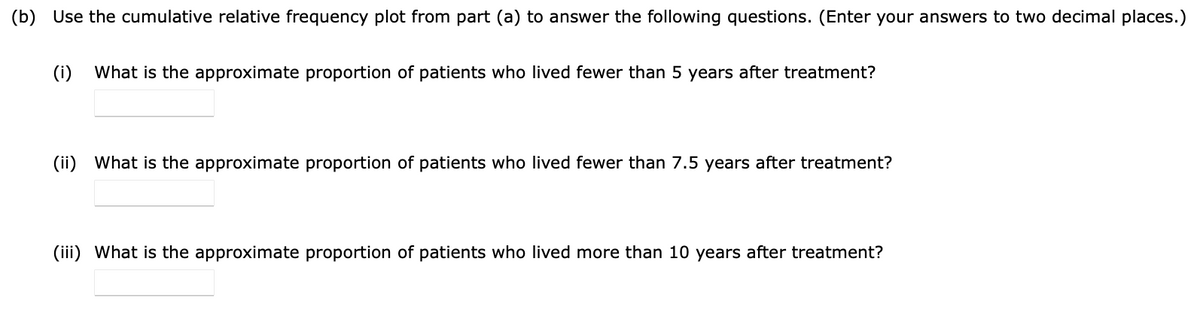
Transcribed Image Text:(b) Use the cumulative relative frequency plot from part (a) to answer the following questions. (Enter your answers to two decimal places.)
(i) What is the approximate proportion of patients who lived fewer than 5 years after treatment?
(ii) What is the approximate proportion of patients who lived fewer than 7.5 years after treatment?
(iii) What is the approximate proportion of patients who lived more than 10 years after treatment?
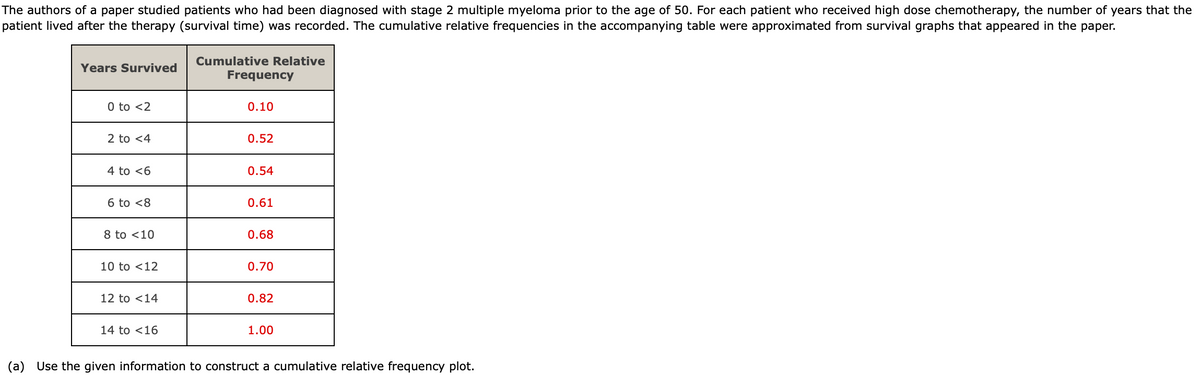
Transcribed Image Text:The authors of a paper studied patients who had been diagnosed with stage 2 multiple myeloma prior to the age of 50. For each patient who received high dose chemotherapy, the number of years that the
patient lived after the therapy (survival time) was recorded. The cumulative relative frequencies in the accompanying table were approximated from survival graphs that appeared in the paper.
Years Survived
0 to <2
2 to <4
4 to <6
6 to <8
8 to <10
10 to 12
12 to <14
14 to 16
Cumulative Relative
Frequency
0.10
0.52
0.54
0.61
0.68
0.70
0.82
1.00
(a) Use the given information to construct a cumulative relative frequency plot.
Expert Solution
This question has been solved!
Explore an expertly crafted, step-by-step solution for a thorough understanding of key concepts.

This is a popular solution!

Trending now
This is a popular solution!

Step by step
Solved in 4 steps with 5 images

Recommended textbooks for you
Glencoe Algebra 1, Student Edition, 9780079039897…
Algebra
ISBN:
9780079039897
Author:
Carter
Publisher:
McGraw Hill

Big Ideas Math A Bridge To Success Algebra 1: Stu…
Algebra
ISBN:
9781680331141
Author:
HOUGHTON MIFFLIN HARCOURT
Publisher:
Houghton Mifflin Harcourt
Glencoe Algebra 1, Student Edition, 9780079039897…
Algebra
ISBN:
9780079039897
Author:
Carter
Publisher:
McGraw Hill
Big Ideas Math A Bridge To Success Algebra 1: Stu…
Algebra
ISBN:
9781680331141
Author:
HOUGHTON MIFFLIN HARCOURT
Publisher:
Houghton Mifflin Harcourt