answer e f g h i

MATLAB: An Introduction with Applications
6th Edition
ISBN:9781119256830
Author:Amos Gilat
Publisher:Amos Gilat
Chapter1: Starting With Matlab
Section: Chapter Questions
Problem 1P

Related questions
Question
answer e f g h i
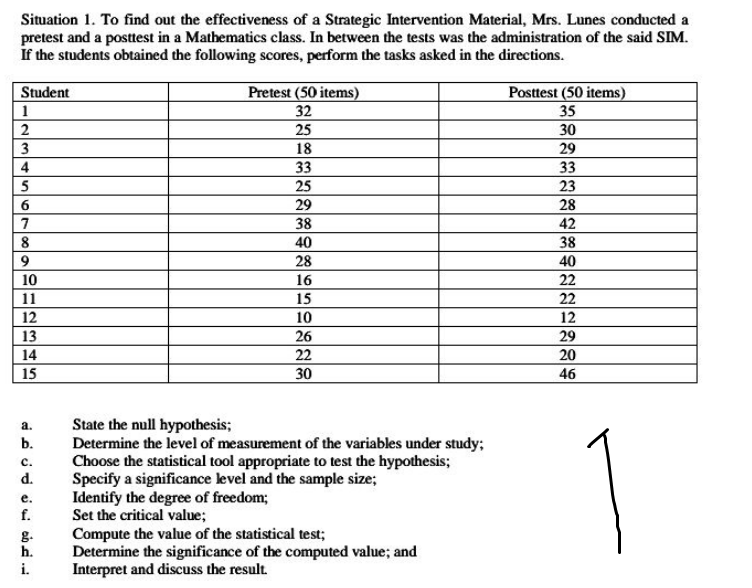
Transcribed Image Text:Situation 1. To find out the effectiveness of a Strategic Intervention Material, Mrs. Lunes conducted a
pretest and a posttest in a Mathematics class. In between the tests was the administration of the said SIM.
If the students obtained the following scores, perform the tasks asked in the directions.
Pretest (50 items)
32
Posttest (50 items)
Student
1
35
25
30
3
18
33
29
4
33
5
25
23
29
28
7
38
42
8
40
38
9.
28
16
40
10
22
11
15
22
12
10
12
13
26
22
30
29
14
20
15
46
State the null hypothesis;
Determine the level of measurement of the variables under study;
Choose the statistical tool appropriate to test the hypothesis;
Specify a significance level and the sample size;
Identify the degree of freedom;
Set the critical value;
а.
b.
с.
d.
е.
f.
g.
h.
Compute the value of the statistical test;
Determine the significance of the computed value; and
Interpret and discuss the result.
i.
Expert Solution
This question has been solved!
Explore an expertly crafted, step-by-step solution for a thorough understanding of key concepts.

This is a popular solution!

Trending now
This is a popular solution!

Step by step
Solved in 2 steps with 2 images

Recommended textbooks for you
MATLAB: An Introduction with Applications
Statistics
ISBN:
9781119256830
Author:
Amos Gilat
Publisher:
John Wiley & Sons Inc

Probability and Statistics for Engineering and th…
Statistics
ISBN:
9781305251809
Author:
Jay L. Devore
Publisher:
Cengage Learning

Statistics for The Behavioral Sciences (MindTap C…
Statistics
ISBN:
9781305504912
Author:
Frederick J Gravetter, Larry B. Wallnau
Publisher:
Cengage Learning
MATLAB: An Introduction with Applications
Statistics
ISBN:
9781119256830
Author:
Amos Gilat
Publisher:
John Wiley & Sons Inc
Probability and Statistics for Engineering and th…
Statistics
ISBN:
9781305251809
Author:
Jay L. Devore
Publisher:
Cengage Learning
Statistics for The Behavioral Sciences (MindTap C…
Statistics
ISBN:
9781305504912
Author:
Frederick J Gravetter, Larry B. Wallnau
Publisher:
Cengage Learning

Elementary Statistics: Picturing the World (7th E…
Statistics
ISBN:
9780134683416
Author:
Ron Larson, Betsy Farber
Publisher:
PEARSON

The Basic Practice of Statistics
Statistics
ISBN:
9781319042578
Author:
David S. Moore, William I. Notz, Michael A. Fligner
Publisher:
W. H. Freeman

Introduction to the Practice of Statistics
Statistics
ISBN:
9781319013387
Author:
David S. Moore, George P. McCabe, Bruce A. Craig
Publisher:
W. H. Freeman