Answer is not complete. Total Company West Central East Amount Amount Amount Amount % 100.0 100.0 Sales 100.0 100.0 1,813,000 699,000 311,000 803,000 Variable expenses 30.5 243,000 30.3 317,000 36.1 45.4 Cost of goods sold 655,000 95,000 80,000 3.9 3.6 39,000 5.6 Shipping expense 4.4 12,000 29,000 Total variable expenses Contribution margin 1,078,000 65.6 531,000 66.1 343,000 59.5 49.1 204,000 Traceable fixed expenses: 52,000 16.7 6.4 107,000 Salaries 210,000 11.6 51,000 15.3 8,800 2.8 1.9 14,400 2.1 Utilities 38,800 2.1 15,600 32.1 103,000 33.1 244.000 30.4 235,000 582,000 33.6 Advertising (Traceable) Depreciation 83,000 4.6 31,000 3.9 27,000 3.9 25,000 8.0 Total traceable fixed expenses 50.4 188,800 42.5 383,400 60.7 913,800 341,600 54.8 9.1 15,200 164,200 4.9 23.6 Regional segment margin (5.8) (40,400) 189,400 Common fixed expenses: Advertising (general) 90,000 5.0 General Administrative expense 63,000 3.5 Total common fixed expense 153,000 8.4 $ Net operating income (loss) 11,200 0.6

Cornerstones of Financial Accounting
4th Edition
ISBN:9781337690881
Author:Jay Rich, Jeff Jones
Publisher:Jay Rich, Jeff Jones
Chapter12: Fainancial Statement Analysis
Section: Chapter Questions
Problem 87PSB
icon
Related questions
Question

I am resubmitting this question as I am getting flagged that there is information missing


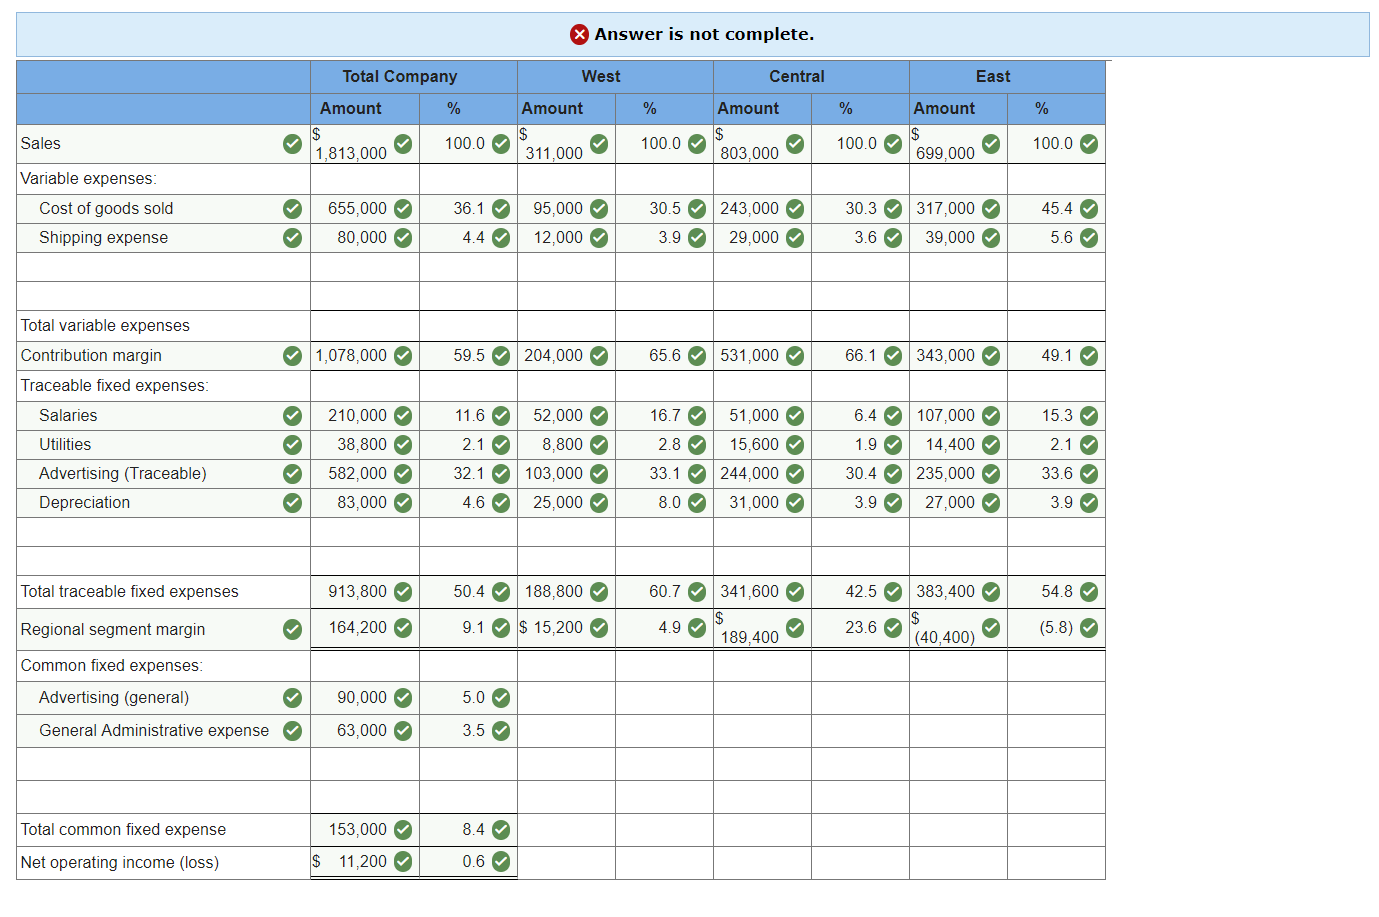
Losses have been incurred at Millard Corporation for some time. In an effort to isolate the problem and improve the company’s performance, management has requested that the monthly income statement be segmented by sales region. The company’s first effort at preparing a segmented statement is given below. This statement is for May, the most recent month of activity.


Sales Region

  West Central East
Sales $ 311,000     $ 803,000     $ 699,000  
Regional expenses (traceable):                      
Cost of goods sold   95,000       243,000       317,000  
Advertising   103,000       244,000       235,000  
Salaries   52,000       51,000       107,000  
Utilities   8,800       15,600       14,400  
Depreciation   25,000       31,000       27,000  
Shipping expense   12,000       29,000       39,000  
Total regional expenses   295,800       613,600       739,400  
Regional income (loss) before corporate expenses   15,200       189,400       (40,400 )
Corporate expenses:                      
Advertising (general)   16,000       39,000       35,000  
General administrative expense   21,000       21,000       21,000  
Total corporate expenses   37,000       60,000       56,000  
Net operating income (loss) $ (21,800 )   $ 129,400     $ (96,400 )


Cost of goods sold and shipping expense are both variable; other costs are all fixed. Millard Corporation is a wholesale distributor of office products. It purchases office products from manufacturers and distributes them in the three regions given above. The three regions are about the same size, and each has its own manager and sales staff. The products that the company distributes vary widely in profitability.


Required:

3. Prepare a new contribution format segmented income statement for May. Show a Total column as well as data for each region. In addition, for the company as a whole and for each sales region, show each item on the segmented income statement as a percent of sales. (Note: % columns may not total due to rounding.) Round percentage answers to 1 decimal place (i.e .1234 should be entered as 12.3).


  Total Company West Central East
  Amount % Amount % Amount % Amount %
Sales $1,813,000 100.0 $311,000 100.0 $803,000 100.0 $699,000 100.0
Variable expenses:                
Cost of goods sold 655,000 36.1 95,000 30.5 243,000 30.3 317,000 45.4
Shipping expense 80,000 4.4 12,000 3.9 29,000 3.6 39,000 5.6
                 
                 
Total variable expenses                
Contribution margin 1,078,000 59.5 204,000 65.6 531,000 66.1 343,000 49.1
Traceable fixed expenses:                
Salaries 210,000 11.6 52,000 16.7 51,000 6.4 107,000 15.3
Utilities 38,800 2.1 8,800 2.8 15,600 1.9 14,400 2.1
Advertising (Traceable) 582,000 32.1 103,000 33.1 244,000 30.4 235,000 33.6
Depreciation 83,000 4.6 25,000 8.0 31,000 3.9 27,000 3.9
                 
                 
Total traceable fixed expenses 913,800 50.4 188,800 60.7 341,600 42.5 383,400 54.8
Regional segment margin 164,200 9.1 $15,200 4.9 $189,400 23.6 $(40,400) (5.8)
Common fixed expenses:                
Advertising (general) 90,000 5.0            
General Administrative expense 63,000 3.5            
                 
                 
Total common fixed expense 153,000 8.4            
Net operating income (loss) $11,200 0.6          


Answer is not complete.
Total Company
West
Central
East
Amount
Amount
Amount
Amount
%
100.0
100.0
Sales
100.0
100.0
1,813,000
699,000
311,000
803,000
Variable expenses
30.5 243,000
30.3 317,000
36.1
45.4
Cost of goods sold
655,000
95,000
80,000
3.9
3.6
39,000
5.6
Shipping expense
4.4
12,000
29,000
Total variable expenses
Contribution margin
1,078,000
65.6 531,000
66.1 343,000
59.5
49.1
204,000
Traceable fixed expenses:
52,000
16.7
6.4 107,000
Salaries
210,000
11.6
51,000
15.3
8,800
2.8
1.9
14,400
2.1
Utilities
38,800
2.1
15,600
32.1 103,000
33.1 244.000
30.4 235,000
582,000
33.6
Advertising (Traceable)
Depreciation
83,000
4.6
31,000
3.9
27,000
3.9
25,000
8.0
Total traceable fixed expenses
50.4 188,800
42.5 383,400
60.7
913,800
341,600
54.8
9.1 15,200
164,200
4.9
23.6
Regional segment margin
(5.8)
(40,400)
189,400
Common fixed expenses:
Advertising (general)
90,000
5.0
General Administrative expense
63,000
3.5
Total common fixed expense
153,000
8.4
$
Net operating income (loss)
11,200
0.6
Transcribed Image Text:Answer is not complete. Total Company West Central East Amount Amount Amount Amount % 100.0 100.0 Sales 100.0 100.0 1,813,000 699,000 311,000 803,000 Variable expenses 30.5 243,000 30.3 317,000 36.1 45.4 Cost of goods sold 655,000 95,000 80,000 3.9 3.6 39,000 5.6 Shipping expense 4.4 12,000 29,000 Total variable expenses Contribution margin 1,078,000 65.6 531,000 66.1 343,000 59.5 49.1 204,000 Traceable fixed expenses: 52,000 16.7 6.4 107,000 Salaries 210,000 11.6 51,000 15.3 8,800 2.8 1.9 14,400 2.1 Utilities 38,800 2.1 15,600 32.1 103,000 33.1 244.000 30.4 235,000 582,000 33.6 Advertising (Traceable) Depreciation 83,000 4.6 31,000 3.9 27,000 3.9 25,000 8.0 Total traceable fixed expenses 50.4 188,800 42.5 383,400 60.7 913,800 341,600 54.8 9.1 15,200 164,200 4.9 23.6 Regional segment margin (5.8) (40,400) 189,400 Common fixed expenses: Advertising (general) 90,000 5.0 General Administrative expense 63,000 3.5 Total common fixed expense 153,000 8.4 $ Net operating income (loss) 11,200 0.6
Expert Solution
trending now

Trending now

This is a popular solution!

steps

Step by step

Solved in 4 steps with 2 images

Blurred answer
Knowledge Booster
Segment Reporting
Learn more about
Need a deep-dive on the concept behind this application? Look no further. Learn more about this topic, accounting and related others by exploring similar questions and additional content below.
Similar questions
  • SEE MORE QUESTIONS
Recommended textbooks for you
Cornerstones of Financial Accounting
Accounting
ISBN:
9781337690881
Author:
Jay Rich, Jeff Jones
Publisher:
Cengage Learning
College Accounting, Chapters 1-27
Accounting
ISBN:
9781337794756
Author:
HEINTZ, James A.
Publisher:
Cengage Learning,
Cornerstones of Cost Management (Cornerstones Ser…
Accounting
ISBN:
9781305970663
Author:
Don R. Hansen, Maryanne M. Mowen
Publisher:
Cengage Learning