Answer the following questions. You may use R on your own computer. 1) [ State the assumption of ANOVA. Then using the boxplot given above, comment the assump- tions of ANOVA are satisfied or not. 2) [ Describe how dummy variables regionSouth, regionWest (in output from summary() fune- tion) are used to indicate cach class. | Write down the estimated regression equation for each group separately. Give interpretation of these equations. Compute the values of these equations. 4) [ We wish to test of hypothesis V8 Ho: 141 142 143
Answer the following questions. You may use R on your own computer. 1) [ State the assumption of ANOVA. Then using the boxplot given above, comment the assump- tions of ANOVA are satisfied or not. 2) [ Describe how dummy variables regionSouth, regionWest (in output from summary() fune- tion) are used to indicate cach class. | Write down the estimated regression equation for each group separately. Give interpretation of these equations. Compute the values of these equations. 4) [ We wish to test of hypothesis V8 Ho: 141 142 143

Glencoe Algebra 1, Student Edition, 9780079039897, 0079039898, 2018
18th Edition
ISBN:9780079039897
Author:Carter
Publisher:Carter
Chapter10: Statistics
Section10.5: Comparing Sets Of Data
Problem 26PFA

Related questions
Question
Please do the following questions with R code
Transcribed Image Text:balance
2000
1500
1000
C.
d.
500
5)
0
South
region
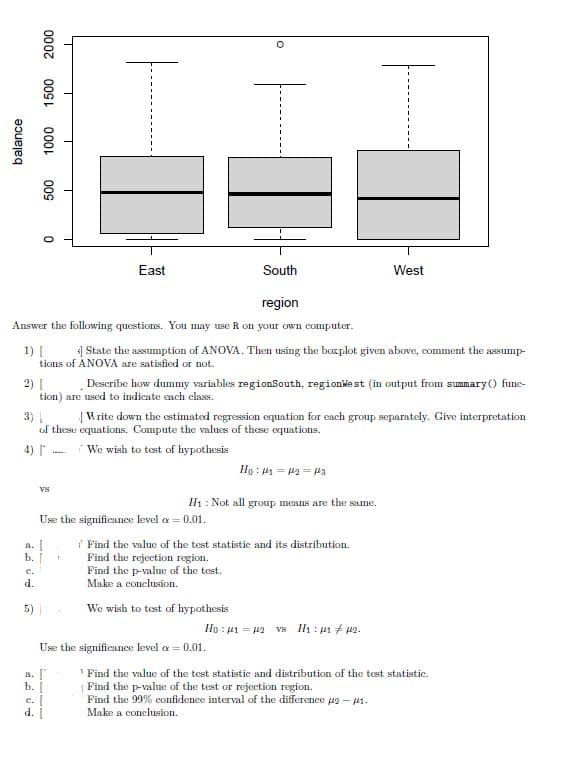
Answer the following questions. You may use R on your own computer.
1) [
State the assumption of ANOVA. Then using the boxplot given above, comment the assump-
tions of ANOVA are satisfied or not.
T
2) [
Describe how dummy variables regionSouth, regionWest (in output from summary() fune-
tion) are used to indicate each class.
VS
a. [
b.
T
3) |
Write down the estimated regression equation for each group separately. Give interpretation
of these equations. Compute the values of these equations.
4) I
We wish to test of hypothesis
East
1
Use the significance level a=0.01.
Ho: ₁1₂=143
H₁ : Not all group means are the same.
Find the value of the test statistic and its distribution.
Find the rejection region.
Find the p-value of the test.
Make a conclusion.
We wish to test of hypothesis
West
Ho: 41 = 42 V8 Hy : μη # 12.
Use the significance level a = 0.01.
a. [
b. [
c. I
d. [
¹ Find the value of the test statistic and distribution of the test statistic.
Find the p-value of the test or rejection region.
Find the 99% confidence interval of the difference 2-11.
Make a conclusion.
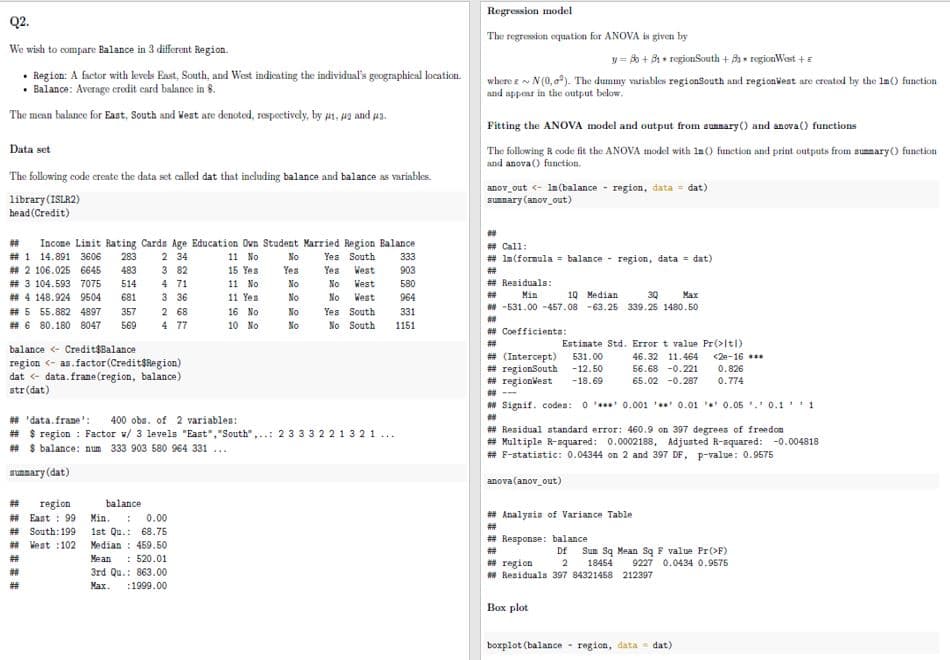
Transcribed Image Text:Q2.
We wish to compare Balance in 3 different Region.
• Region: A factor with levels East, South, and West indicating the individual's geographical location.
• Balance: Average credit card balance in 8.
The mean balance for East, South and West are denoted, respectively, by #1, #2 and a.
Data set
The following code create the data set called dat that including balance and balance as variables.
library (ISLR2)
head (Credit)
# Income Linit Rating Cards Age Education Own Student Married Region Balance
#1 14.891 3606 283 2 34
11 No
Yes South
15 Yes
Yes West
3 82
4 71
11 No
No West
## 2 106.025 6645 483
#3 104.593 7075 514
## 4 148.924 9504 681
#5 55.882 4897 357
##6 80.180 8047 569
3 36
11 Yes
No West
16 No
10 No
balance < Credit$Balance
region <- as.factor (Credit$Region)
dat < data.frame (region, balance)
str(dat)
2 68
4 77
#
region
## East: 99
# South: 199
# West :102
#
#
No
Yes
No
No
## 'data.frame': 400 obs. of 2 variables:
# $ region: Factor v/ 3 levels "East", "South",..: 2 3 3 3 2 2 1 321...
## $ balance: num 333 903 580 964 331...
sunnary (dat)
balance
Min.: 0.00
1st Qu.: 68.75
Median 459.50
Mean : 520.01
3rd Qu.: 863.00
Max. :1999.00
No
No
Yes South
No South
333
903
580
964
331
1151
Regression model
The regression equation for ANOVA is given by
y = Bo +31 + region South + B regionWest + E
where ~ N(0,²). The dummy variables regionSouth and regionWest are created by the In() function
and appear in the output below.
Fitting the ANOVA model and output from sunmary() and anova () functions
The following R code fit the ANOVA model with 1n() function and print outputs from summary() function
and anova () function.
anov_out <- In (balance region, data = dat)
summary (anov_out)
##
## Call:
# In (formula = balance region, data = dat)
# Residuals:
10 Median
## Min
3Q Max
## -531.00 -457.08 -63.25 339.25 1480.50
**
## Coefficients:
#
Estimate Std. Error t value Pr(>ltl)
46.32 11.464
56.68 -0.221
65.02 -0.287
# (Intercept) 531.00
#regionSouth -12.50
#regionWest -18.69
** Signif. codes: 00.001 0.01 0.05 0.11
##
#Residual standard error: 460.9 on 397 degrees of freedom
## Multiple R-squared: 0.0002188, Adjusted R-squared: -0.004818
# F-statistic: 0.04344 on 2 and 397 DF, p-value: 0.9575
anova (anov_out)
## Analysis of Variance Table
#
#Response: balance
<2e-16 ***
0.826
0.774
##
## region
##Residuals 397 84321458 212397
Box plot
Df Sun Sq Mean Sq F value Pr(>F)
2 18454 9227 0.0434 0.9575
boxplot (balance region, data dat)
-
Expert Solution
This question has been solved!
Explore an expertly crafted, step-by-step solution for a thorough understanding of key concepts.

Step by step
Solved in 6 steps with 3 images

Recommended textbooks for you
Glencoe Algebra 1, Student Edition, 9780079039897…
Algebra
ISBN:
9780079039897
Author:
Carter
Publisher:
McGraw Hill

Holt Mcdougal Larson Pre-algebra: Student Edition…
Algebra
ISBN:
9780547587776
Author:
HOLT MCDOUGAL
Publisher:
HOLT MCDOUGAL

Glencoe Algebra 1, Student Edition, 9780079039897…
Algebra
ISBN:
9780079039897
Author:
Carter
Publisher:
McGraw Hill
Holt Mcdougal Larson Pre-algebra: Student Edition…
Algebra
ISBN:
9780547587776
Author:
HOLT MCDOUGAL
Publisher:
HOLT MCDOUGAL