Answer the question in the picture. The following data represent the age (in weeks) at which babies first crawl based on a survey of 12 mothers. The data are normally distributed and s=10.128 weeks. Construct and interpret a 95% confidence interval for the population standard deviation of the age (in weeks) at which babies first crawl.
Answer the question in the picture. The following data represent the age (in weeks) at which babies first crawl based on a survey of 12 mothers. The data are normally distributed and s=10.128 weeks. Construct and interpret a 95% confidence interval for the population standard deviation of the age (in weeks) at which babies first crawl.

Glencoe Algebra 1, Student Edition, 9780079039897, 0079039898, 2018
18th Edition
ISBN:9780079039897
Author:Carter
Publisher:Carter
Chapter10: Statistics
Section10.3: Measures Of Spread
Problem 26PFA

Related questions
Topic Video
Question
Answer the question in the picture.
The following data represent the age (in weeks) at which babies first crawl based on a survey of 12 mothers. The data are
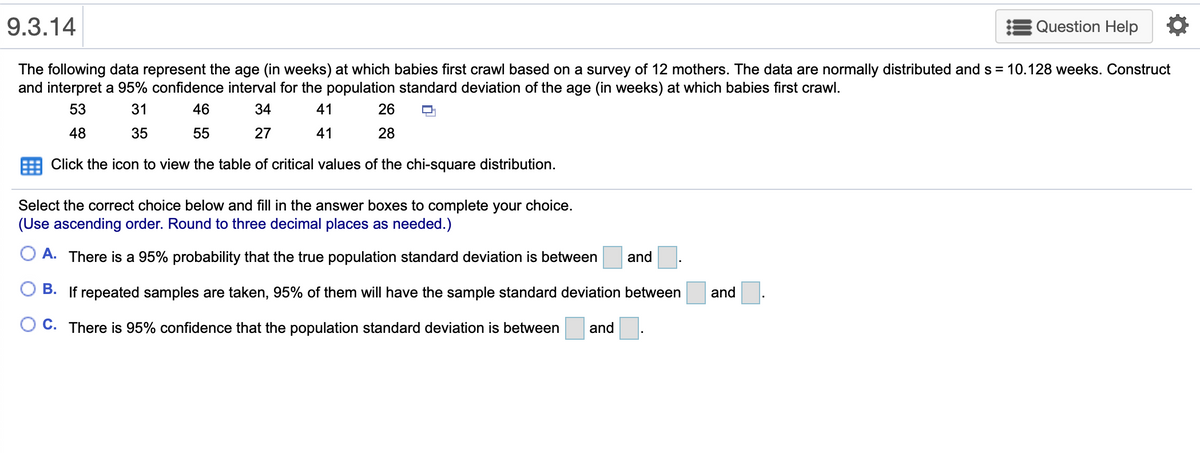
Transcribed Image Text:9.3.14
Question Help
The following data represent the age (in weeks) at which babies first crawl based on a survey of 12 mothers. The data are normally distributed and s = 10.128 weeks. Construct
and interpret a 95% confidence interval for the population standard deviation of the age (in weeks) at which babies first crawl.
53
31
46
34
41
26
48
35
55
27
41
28
Click the icon to view the table of critical values of the chi-square distribution.
Select the correct choice below and fill in the answer boxes to complete your choice.
(Use ascending order. Round to three decimal places as needed.)
O A. There is a 95% probability that the true population standard deviation is between
and
O B. If repeated samples are taken, 95% of them will have the sample standard deviation between
and
C. There is 95% confidence that the population standard deviation is between
and
Expert Solution
This question has been solved!
Explore an expertly crafted, step-by-step solution for a thorough understanding of key concepts.

This is a popular solution!

Trending now
This is a popular solution!

Step by step
Solved in 3 steps with 5 images

Knowledge Booster


Learn more about
Need a deep-dive on the concept behind this application? Look no further. Learn more about this topic, statistics and related others by exploring similar questions and additional content below.Recommended textbooks for you
Glencoe Algebra 1, Student Edition, 9780079039897…
Algebra
ISBN:
9780079039897
Author:
Carter
Publisher:
McGraw Hill
Glencoe Algebra 1, Student Edition, 9780079039897…
Algebra
ISBN:
9780079039897
Author:
Carter
Publisher:
McGraw Hill