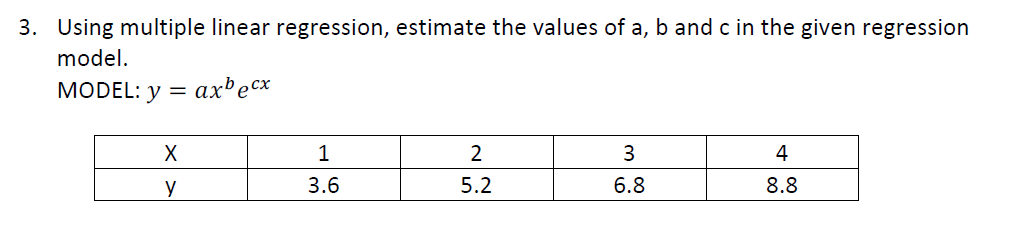
Answers in the internet mostly say that a = 3.0490, b = 0.2796, and c = 0.1673, but my quiz said I'm incorrect.


Q: In this problem, assume that the distribution of differences is approximately normal. Note: For…
A:
Q: From the data/table above Calculate and discuss** the followings. Please provide the steps for the…
A: firstly, let's arrange the temperature values in ascending order Temp. values 17.7 18.4 19.5 19.5…
Q: Let X and Y have the following joint probability function. a) Find the probability functions for X…
A:
Q: You wish to test the following claim (Ha) at a significance level of a = 0.05. Ho: P1 = P2 Ha: P1 P2…
A: The following information has been given: p^1=0.176 p^2=0.11n1=598 n2=536
Q: Test the claim that the mean GPA of night students is larger than 2.1 at the 0.025 significance…
A: Given Mu=2.1 Mean=2.13 Standard deviations=0.04 n=65
Q: In an experiment, die is rolled continually until a 6 appears, at which point the experiment stops.…
A: Sample Space A sample space is a collection or a group of possible outcomes of a random experiment.…
Q: The number of paid reservation that do turn up at a hotel even when they already made a paid…
A: Chi square test are used to determine the signifiance between the categorical variable. It follows…
Q: 5. The following regression results relate to a study of computer sales (in dollars) as a function…
A: Introduction: The dependent variable is computer sales in dollars, and the independent variables are…
Q: ou wish to test the following claim (HaHa) at a significance level of α=0.001.…
A: Given, Population proportion p=0.81 n=454 x=360 significance level of α=0.001.
Q: I am to do a project for an inferential statistics class and I would like some basic guidance. I…
A: An inferential analysis is a statistical process that tends to suggest qualities of a larger number…
Q: An important factor in solid missile fuel is the particle size distribution. Significant problems…
A: Given: It is given that the probability distribution function of particle size is: f(X) = 7X-8, 0,…
Q: Systolic blood pressure levels above 120 mm Hg are considered to be high. For the 100 systolic blood…
A: Given that : u = 120 mm Hg Mean = 120.48000 ? = 15.73549 By using the one sample mean z test we…
Q: If n = 81, -45, and s to one decimal place. = 8, construct a confidence interval at a 90% confidence…
A:
Q: A marketing agency states that online purchase practice is related to age. To test this statement a…
A:
Q: Box A contains 5 red and 3 white marbles and box B contains 2 red and 6 white marbles. If a marble…
A:
Q: iii) P (-0.20 ≤z≤-.50) 0.1122 O-0.1122 0.8878 O 0.5
A: Given distribution is standard normal.
Q: It is desired to estimate the proportion of cannabis users at a university. What is the sample size…
A: Sample size formula when population proportion is not known n ≥ 0.25 * ( Z / E )2
Q: 18.42 This Wine Stinks. How sensitive are the untrained noses of students? Exercise 16.27 (page 381)…
A: The simple random sample size formula is defined as follows, when population standard deviation (σ)…
Q: The pulse rates of 174randomly selected adult males vary from a low of 39 bpm to a high of 111 bpm.…
A: Given,low value=39 bpmhigh value=111 bpmmargin of error(E)=3α=1-0.99=0.01α2=0.005Z0.005=2.58…
Q: As part of a real estate company study, the selling prices of 50 homes in a particular neighborhood…
A: Given n=50, sample mean x̄=234,000, s=28500 Construct 95% CI for population mean μ
Q: A custodian wishes to compare two competing floor waxes to decide which one is best. He believes…
A: Given: Sample size:n1=20n2=17Sample mean:x¯1=26.4x¯2=27.2Standard deviation:s1=8.6s2=6.6 Hypothesis:…
Q: You work for the U.S. Food and Drug Administration. You have gotten word that a drug manufacturing…
A: Solution: n= 20 Sample size x =∑xn=702420=351.2 Sample mean s=∑(x-x)2n-1s= 5.7820 Sample standard…
Q: Confidence Levels and Z-Scores Confidence Level 90% Z-Score 1.65 5. For a survey of 700 people in…
A:
Q: Express the confidence interval 0.555 <p < 0.999 in the form p + E. p±E= ±
A: Given: Confidence interval = 0.555 < p < 0.999 Formula Used: Confidence interval = p^ ± E…
Q: Give the range and the IQR.
A: Here Given for Participants in Nutritionstudy Here From 5 point summary Min = 445 Q1=1334 Q2=1667…
Q: The American Society for Quality (ASQ) conducted a salary survey of all its members. ASQ members…
A: Given that: Job Title Sample Size Minimum Maximum Standard deviation Mean Median Green Belt 26…
Q: The Z-score tells you the number of standard deviations away from the mean (and in what direction) a…
A: Formula : z = (X-u) /σ
Q: A leading magazine (like Barron's) reported at one time that the average number of weeks an…
A: Assume that the length of unemployment is normally distributed with population mean of 25 weeks and…
Q: Wall thickness of 25 glass 2-liter bottles was measured by a quality-control engineer. The sample…
A:
Q: A poultry farmer is curious about the effectiveness of two types o additive in poultry feed. The…
A: Experimental Design A design or a plan that is providing a solution by interchangeable means and is…
Q: Check here for instructional material to complete this problem. d-pd Sd √n Evaluate t = for d = 1,…
A: Givend=1μd=0sd=2.828n=8
Q: Ocho
A:
Q: If x represents a random variable with mean 131 and standard deviation 40, then the standard…
A: Given that ; u = 131 ? = 40 Sample size ( n) = 100 Here we use the concept of standard normal…
Q: Two random samples were taken from distinct populations. The sample from population one was of size…
A: The sample of 86 is drawn from population 1 and it contains 19 successes. i.e. n1=86, x1=19 X1 :…
Q: Park Police Departme f
A: There are four types of level of measurement nominal, ordinal, interval and ratio ordinal level :…
Q: A maker of a certain brand of low-fat cereal bars claims that the average saturated fat content is…
A:
Q: You wish to test the following claim (Ha) at a significance level of a = 0.05. Ho: P1 = P2 Ha: P1 P2…
A: Given; n1 = 271 Number of success X1 = 103 n2 = 362 Number of success X2 = 155 α = 0.05 Formula…
Q: The following figure shows the normal distribution with the proportion of the area under the normal…
A: Given: μ = 269 σ = 33 Formula Used: z-score = X-μσ
Q: A random sample of 200 students is taken at the park in order to determine the proportion who smoke…
A: Given data n=200 x=150 confidence interval is 95%
Q: institute poll asked respondents if they felt vulnerable to identity theft. In the poll, n=1087 and…
A: Given that X = 562 , n = 1087 Confidence level 90%
Q: You are testing the claim that the proportion of men who own cats is smaller than the proportion of…
A: Given data: claim The proportion of men who own cats is smaller than the proportion of women who…
Q: mistake six burned out light bulbs (B) have been mixed up with 4 good (G) ones. If a random sample…
A: Given that ; Bad bulbs ( B) = 6 Good Bulbs ( G) = 4 Total bulbs (N) = 6 +4 = 10 By using combination…
Q: A maker of a certain brand of low-fat cereal bars claims that the average saturated fat content is…
A: t-test The t-test is used to compare the mean of two samples. Mainly the t-test is used in…
Q: What is the height of the uniform distribution? (That is the height at every x between 2 and 6 of…
A: It is given that the Uniform distribution is defined for 2 < X < 6. The pdf of uniform…
Q: Test the claim that the proportion of men who own cats is smaller than the proportion of women who…
A: From the provided information,
Q: A pollster is going to sample a number of voters in a large city and construct a 98% confidence…
A: Given: Confidence level is 98% Margin of error is 0.05 Required: To find the sample size.
Q: The following data represent the running times of films produced by two different motion-picture…
A: Given that: Significance level, α=0.1
Q: Conduct the hypothesis test and provide the test statistic and the critical value, and state the…
A: Given Total no of checks = 100. Significance level=0.1 We need to find the test statistic, critical…
Q: 3. In genetic investigations, one frequently samples from a binomial distribution. Except that…
A: Given Information: Consider the given function: fx=mxpx1-pm-x1-1-pm for x ∈1,2,...m
Q: A student wishes to see if at her school the proportion of underclassmen who do not have have a job…
A: Given,n1=257 , x1=55n2=288 , x2=45p^1=x1n1p^1=55257=0.21401p^2=x2n2p^2=45288=0.15625pooled…
Answers in the internet mostly say that a = 3.0490, b = 0.2796, and c = 0.1673, but my quiz said I'm incorrect.

Step by step
Solved in 3 steps with 2 images

- Olympic Pole Vault The graph in Figure 7 indicates that in recent years the winning Olympic men’s pole vault height has fallen below the value predicted by the regression line in Example 2. This might have occurred because when the pole vault was a new event there was much room for improvement in vaulters’ performances, whereas now even the best training can produce only incremental advances. Let’s see whether concentrating on more recent results gives a better predictor of future records. (a) Use the data in Table 2 (page 176) to complete the table of winning pole vault heights shown in the margin. (Note that we are using x=0 to correspond to the year 1972, where this restricted data set begins.) (b) Find the regression line for the data in part ‚(a). (c) Plot the data and the regression line on the same axes. Does the regression line seem to provide a good model for the data? (d) What does the regression line predict as the winning pole vault height for the 2012 Olympics? Compare this predicted value to the actual 2012 winning height of 5.97 m, as described on page 177. Has this new regression line provided a better prediction than the line in Example 2?Given a generic data set (x,y) with a linear regression. How do you determine if the y(dependent) will be less than a certain value?Given a generic data set (x,y) with a linear regression. How do you determine if the y(dependent) will be less/greater than a certain value at a decided value of x?
- The estimated regression equation for a model involving two independent variables and 10 observations follows.A real estate analyst has developed a multiple regression line, y = 60 + 0.068 x1 – 2.5 x2, to predict y = the market price of a home (in $1,000s), using two independent variables, x1 = the total number of square feet of living space, and x2 = the age of the house in years. With this regression model, the predicted price of a 10-year old home with 2,500 square feet of living area is __________. $205.00 $200,000.00 $205,000.00 $255,000.00Create the regression equations based on the research model below!
- Plot the linear regression line y = 3 + 0.5x without using excel with proper labellingCalculate the estimated R2 and state why we should consider using adjusted R2 instead of R2 in the setting of multiple linear regression?Would I use the regression line to predict Y from X ? And what is the pattern of the scatterplot?
- The predictions made using multiple regression are often more ______ than the predictions made using linear regression with one predictor variable.In a simple linear regression, show that the OLS regression line always passes through the mean (average) of both x and y.Discuss the relationship of the negative sign or positive sign in the value ofcorrelation coefficient or “r” to the direction of the linear regressionequation or “y hut.”
