Apple PROFITABILITY & LIQUIDITY, SOLVENCY, & EFFICIENCY RATIOS 2023-2022 All Data is in Millions Formula 2023 Results 2022 Results Statement Formula 2023 Results 2022 Results Cash Conversion Cycle 2023 2022 Gross Profit % (also called Gross Profit Gross Profit Income Statement Accounts Receivable Turnover Revenue Margin) Revenue Income Statement Average Account Receivables Days In Inventory (DII) 0.00 0.00 2023 Results 2022 Results Formula 2023 Results 2022 Results Days Sales Outstanding (DSO) 0.00 0.00 Net Profit % Net Income Income Statement Days' Sales Days In Year 365 365 Days Payable Outstanding (DPO) 0.00 0.00 (also called Gross Profit in Receivables Margin) Revenue Income Statement Accounts Receivables Turnover Cash Conversion Cycle 0.00 0.00 2023 Results 2022 Results Formula 2023 Results 2022 Results NOTE: You will need to calculate your own Average for each Turnover Ratio: Total Liabilities Balance Sheet Debt to Asset Ratio Inventory Turnover Total Assets Balance Sheet Cost of Good Sold Average Inventory Average Equation: 2023 Average: (2023 + 2022)/2 2023 Results 2022 Results Formula 2023 Results 2022 Results 2022 Average: (2022 + 2021)/2 Current Assets Balance Sheet Current Ratio Current Liabilities Balance Sheet Days' Sales in Inventory Days In Year Inventory Turnover 365 365 2023 Results 2022 Results Formula 2023 Results 2022 Results (Current Assets Quick Ratio - Inventory) Current Liabilities Balance Sheet Balance Sheet Balance Sheet Accounts Payable Turnover Cost of Goods Sold Average Accounts Payables Formula 2023 Results 2022 Results 2023 Results 2022 Results Payable Turnover Cash Flow in Days Days In Year Accounts Payables Turnover 365 365 Free Cash Flow Cash generated by operating activities Property, Plant, and Equipment Cash Flow
Apple PROFITABILITY & LIQUIDITY, SOLVENCY, & EFFICIENCY RATIOS 2023-2022 All Data is in Millions Formula 2023 Results 2022 Results Statement Formula 2023 Results 2022 Results Cash Conversion Cycle 2023 2022 Gross Profit % (also called Gross Profit Gross Profit Income Statement Accounts Receivable Turnover Revenue Margin) Revenue Income Statement Average Account Receivables Days In Inventory (DII) 0.00 0.00 2023 Results 2022 Results Formula 2023 Results 2022 Results Days Sales Outstanding (DSO) 0.00 0.00 Net Profit % Net Income Income Statement Days' Sales Days In Year 365 365 Days Payable Outstanding (DPO) 0.00 0.00 (also called Gross Profit in Receivables Margin) Revenue Income Statement Accounts Receivables Turnover Cash Conversion Cycle 0.00 0.00 2023 Results 2022 Results Formula 2023 Results 2022 Results NOTE: You will need to calculate your own Average for each Turnover Ratio: Total Liabilities Balance Sheet Debt to Asset Ratio Inventory Turnover Total Assets Balance Sheet Cost of Good Sold Average Inventory Average Equation: 2023 Average: (2023 + 2022)/2 2023 Results 2022 Results Formula 2023 Results 2022 Results 2022 Average: (2022 + 2021)/2 Current Assets Balance Sheet Current Ratio Current Liabilities Balance Sheet Days' Sales in Inventory Days In Year Inventory Turnover 365 365 2023 Results 2022 Results Formula 2023 Results 2022 Results (Current Assets Quick Ratio - Inventory) Current Liabilities Balance Sheet Balance Sheet Balance Sheet Accounts Payable Turnover Cost of Goods Sold Average Accounts Payables Formula 2023 Results 2022 Results 2023 Results 2022 Results Payable Turnover Cash Flow in Days Days In Year Accounts Payables Turnover 365 365 Free Cash Flow Cash generated by operating activities Property, Plant, and Equipment Cash Flow

Century 21 Accounting General Journal
11th Edition
ISBN:9781337680059
Author:Gilbertson
Publisher:Gilbertson
Chapter17: Financial Statement Analysis
Section: Chapter Questions
Problem 1AP

Related questions
Question
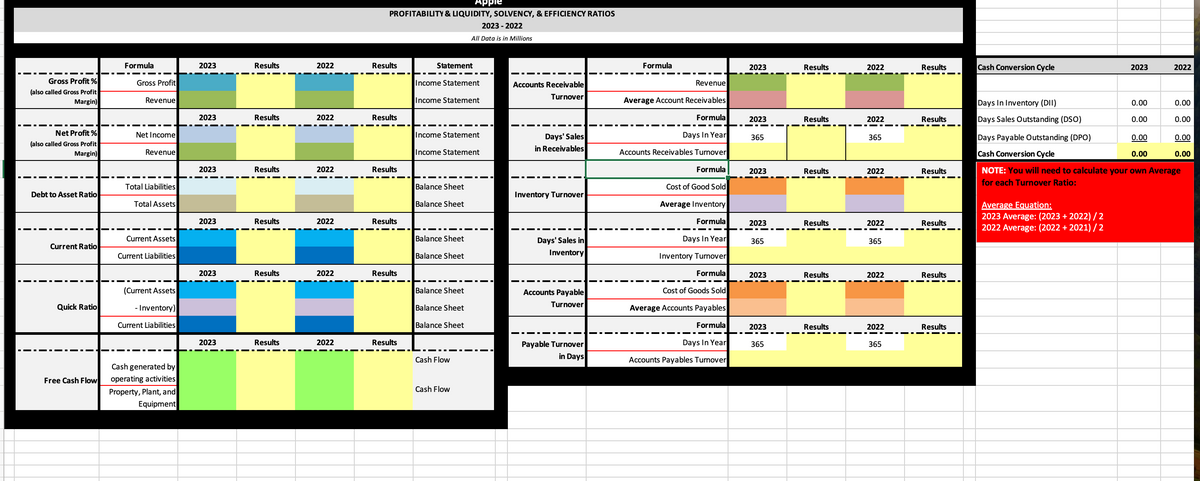
SPREADSHEET DIRECTIONS:
Apple Inc. wants to conduct a comparative Ratio Analysis of their last 2 years to reveal insight into their profitability, liquidity, solvency, and operational efficiency.
Utilize the provided Ratios to complete the Analysis.
Utilize the APPLE Income Statement, APPLE Balance Sheet, APPLE Cash Flow Statement Spreadsheets and the Ratio Equations to complete the missing colored cells.
spreadsheet https://docs.google.com/spreadsheets/d/1PMxi_-pVCN3FvbeCZTQ7q9caeDtA1x1x/edit?usp=sharing&ouid=103368527338324517598&rtpof=true&sd=true
Transcribed Image Text:Apple
PROFITABILITY & LIQUIDITY, SOLVENCY, & EFFICIENCY RATIOS
2023-2022
All Data is in Millions
Formula
2023
Results
2022
Results
Statement
Formula
2023
Results
2022
Results
Cash Conversion Cycle
2023
2022
Gross Profit %
(also called Gross Profit
Gross Profit
Income Statement
Accounts Receivable
Turnover
Revenue
Margin)
Revenue
Income Statement
Average Account Receivables
Days In Inventory (DII)
0.00
0.00
2023
Results
2022
Results
Formula
2023
Results
2022
Results
Days Sales Outstanding (DSO)
0.00
0.00
Net Profit %
Net Income
Income Statement
Days' Sales
Days In Year
365
365
Days Payable Outstanding (DPO)
0.00
0.00
(also called Gross Profit
in Receivables
Margin)
Revenue
Income Statement
Accounts Receivables Turnover
Cash Conversion Cycle
0.00
0.00
2023
Results
2022
Results
Formula
2023
Results
2022
Results
NOTE: You will need to calculate your own Average
for each Turnover Ratio:
Total Liabilities
Balance Sheet
Debt to Asset Ratio
Inventory Turnover
Total Assets
Balance Sheet
Cost of Good Sold
Average Inventory
Average Equation:
2023 Average: (2023 + 2022)/2
2023
Results
2022
Results
Formula
2023
Results
2022
Results
2022 Average: (2022 + 2021)/2
Current Assets
Balance Sheet
Current Ratio
Current Liabilities
Balance Sheet
Days' Sales in
Inventory
Days In Year
Inventory Turnover
365
365
2023
Results
2022
Results
Formula
2023
Results
2022
Results
(Current Assets
Quick Ratio
- Inventory)
Current Liabilities
Balance Sheet
Balance Sheet
Balance Sheet
Accounts Payable
Turnover
Cost of Goods Sold
Average Accounts Payables
Formula
2023
Results
2022
Results
2023
Results
2022
Results
Payable Turnover
Cash Flow
in Days
Days In Year
Accounts Payables Turnover
365
365
Free Cash Flow
Cash generated by
operating activities
Property, Plant, and
Equipment
Cash Flow
AI-Generated Solution

Unlock instant AI solutions
Tap the button
to generate a solution
Recommended textbooks for you
Century 21 Accounting Multicolumn Journal
Accounting
ISBN:
9781337679503
Author:
Gilbertson
Publisher:
Cengage

Cornerstones of Financial Accounting
Accounting
ISBN:
9781337690881
Author:
Jay Rich, Jeff Jones
Publisher:
Cengage Learning
Century 21 Accounting Multicolumn Journal
Accounting
ISBN:
9781337679503
Author:
Gilbertson
Publisher:
Cengage
Cornerstones of Financial Accounting
Accounting
ISBN:
9781337690881
Author:
Jay Rich, Jeff Jones
Publisher:
Cengage Learning

Managerial Accounting: The Cornerstone of Busines…
Accounting
ISBN:
9781337115773
Author:
Maryanne M. Mowen, Don R. Hansen, Dan L. Heitger
Publisher:
Cengage Learning

Survey of Accounting (Accounting I)
Accounting
ISBN:
9781305961883
Author:
Carl Warren
Publisher:
Cengage Learning

Intermediate Financial Management (MindTap Course…
Finance
ISBN:
9781337395083
Author:
Eugene F. Brigham, Phillip R. Daves
Publisher:
Cengage Learning