Approximate the measures of center for following GFDT. Data Frequency 60 - 64 2 65 - 69 1 70 - 74 11 75 - 79 24
Q: Analyze the data in the table, then answer the questions below. Measurement (g) True value (g)…
A: Absolute error in both the measurements is 0.001 So, absolute error of both the measurements is same
Q: Find pupolation skewness of data 49 56 55 35 34 57 38 40 35
A:
Q: Determine the range of the following raw data. Write your solution.
A: A measure of variability is a summary statistic that represents the amount of dispersion in a…
Q: Consider the results of 3(b). Notice that all the data fit within the 99% confidence interval. Is…
A: Given data, 54,276 57,378 51,108 66,190 66,232 59,018 57,159 These data yield the following: ̄y =…
Q: As part of the National Health and Nutrition Examination Survey, the Department of Health and Human…
A: State the hypotheses. That is, there is no difference between the the reported height vs. the…
Q: Calculate the coefficient of skewness from the following data : e'noerse he Mid-point : Frequency :…
A:
Q: 2nd Data Set: 4,2,1,3,4,4,3,3,3,4,3,3 (SD=0.90)
A: Note: Hi! Thank you for the question. As you have specifically requested with data set 2, we have…
Q: Calculate the range for the time taken for a client to buy your product using this data. 45, 32, 29,…
A: given data;45,32,29,63,15,15data in ascending order;15,15,29,32,45,63
Q: Classify the following data. Indicate whether the data is qualitative or quantitative, indicate…
A: Qualitative data: The data value are the the non-numerical quality or characteristic. Quantitative…
Q: The weight (in pounds) and height (in inches) for a child were measured every few months over a…
A: Step-by-step procedure to obtain the regression equation using Excel is as follows: Enter the…
Q: The following models have the indicated AIC values. Which is the best model based on this metric?…
A:
Q: Find the weighted average of these values. Value Weight 1.00 75.0% 2.00 15.0% 3.00 10.0% weighted…
A: Given data, Value weight 1 75% 2 15% 3 10% Weighted average: Weighted average=∑wixi∑wi
Q: Construct index number of price from the following data by applying: a ) Laspeyre’s method…
A:
Q: The lengths and weights of a zoo's pygmy shrews were recorded during their annual health check.…
A: The regression equation is given by y = a + bX
Q: 3. The height of basketball players is considered what kind of data? * A. Nominal B. Ordinal C.…
A: Answer - The height of basketball players is considered what kind of data?
Q: (a) Is the given data nominal, ordinal, interval, or ratio? Explain. The data above is ratio.…
A: In statistics, there are four data measurement scales: nominal, ordinal, interval and ratio.The two…
Q: Q1. Define the following terms: A) Statistics. B) Quantitative data. C) Average:
A: A) Statistics : It is a science of collecting , Analyzing and interpretation of numerical data such…
Q: A car safety association conducted tests to measure the stopping distances of a new model of car and…
A:
Q: Find the range for the set of data given. 21) 111 484 170 617 360 290 A) 484 B) 111 C) 120 D) 506
A: The given data is, 111, 484, 170, 617, 360, 290.
Q: The following data set is scaled scores from the SAT test in 2017: 310, 800, 450, 610, 580, 510,…
A: Solution Given SAT scores are scaled from 200 to 800 points.
Q: The table contains data on the admission price (in dollars) for one-day tickets to 10 theme parks in…
A: Given values: 55, 61, 42, 44, 28, 48, 64, 44, 40, 42. Arrange the data in ascending order: 28, 40,…
Q: The following travel times were measured for vehicles as they traveled a 15-mile segment of highway.…
A:
Q: You go out and collect the following estimates of earthworms / acre: 54,276 57,378 51,108…
A: a. 90% CI is given by- y±z*sn z value is found from z tables which is 1.645. sample size (n) is 7.…
Q: A master marksman hires an accomplished craftsman to design recurve bows for his latest line of…
A: Mean square of the error (MSE) is calculated by dividing the sum of squares of the residual…
Q: Use the data set and line plot below. How many feathers are 2- inches or shorter? Fox Sparrow…
A: In the plot count number of dots corresponding to 214 and less than it. Thus, number of feathers…
Q: A semiconductor manufacturer produces devices used as central processing units in personal…
A: Given the data of the speed of two model devices A and B as Model A Model B 680 652 669 720…
Q: 46 Find the mode from the following data Value Values Frequency Below 30 25 Below 50 97 45 95
A: Given :
Q: Which of the following is an example of ratio data? a. temperature b. attractiveness c. weight d.…
A: Answer: Option c) Weight
Q: Data was collected for 300 fish from the North Atlantic. The length of the fish (in mm) is…
A: Here Frequency distribution table is in class limit form. We need to convert Class limit to class…
Q: Approximate the measures of center for following GFDT. Data Frequency 30 34 2 35 39 40 44 4 45 49 4…
A: Measure of central tendency measures the central or average value of a dataset. Measured of…
Q: The histogram to the right represents the weights (in pounds) of members of a certain high-school…
A: Given histogram, Frequency table ,
Q: Make a pie chart using the data below Science Club = 30% Math Club = 40% English Club = 20% History…
A: The objective is to make a pie chart for the data. It is known that the total angle in a circle is…
Q: The scatter diagram is shown below. 98 90.4 82.8 Weight 75.2 67.6 60 158 165 4 172.0 1802 187.6 195…
A: The strength and direction of linear relationship between two variables is measured by correlation.…
Q: Create a 99% con fidence interval for the data set below. 64 61 54 70 60 | 56 64 59 55 61| 59 (three…
A: Given that Data values - 64 , 61, 54, 70 , 60 , 56, 64 , 59 , 55 , 61 , 59 Number of data values…
Q: Determine which type of chart is the most appropriate representation for the following data : The…
A:
Q: Which model appears to be the best accordingly? A. Model I B. Model II C. Model III D. Model IV
A: Given are a few Linear Models and their Error Sum of Squares.
Q: Complete parts (a) through (h) for the data below 30 40 50 60 70 y 80 77 73 66 52
A: Scatter diagram are useful to visually examine the slope, direction of data set.
Q: Paasche's index for 2005 is : (A) 48.12 (B) 49.12 (C) 47.12 (D) 46.12.
A: It is given that ∑p1q1 = 450.1 ∑p0q1 = 916.3
Q: What type of data is the total distance represented in the table below? Time (minutes)Total Distance…
A: It is an important part of statistics. It is widely used.
Q: Find the percentile for the data value. Data set: 20 20 70 40 20 50 90 90 110 30 20 90 60 10 90;…
A: Arrange the data in order. 10, 20, 20, 20, 20, 30, 40, 50, 60, 70, 90, 90, 90, 90, 110.
Q: Identify which of the four levels of measurement (nominal, ordinal, interval, or ratio) is most…
A: Levels of measurement: The level of measurement is describes the classification of the nature of…
Q: Find the average price and med Price Per Number of Item Items $13 4 $16 $17 8. $22 6. Average price:…
A: the given data is as follows Price Per item (x) number of items (f) cumulative frequency cf 13…
Q: The value of the middle term in a ranked data set is called the Ipovězeno a. mean bodů z b. median…
A: We have to find term used to represent middle term in the ranked data set.
Q: Using the following stem & leaf plot, find the five number summary for the data. 0 2 3 4 4 59 3 4 2…
A:
Q: Approximate the measures of center for following GFDT. Data Frequency 50 -54 55 -59 60-64 10
A: Calculate Mean, Median, Mode from the following grouped data Class Frequency 50 - 54 1 55 -…
Q: Calculate 2 (x-bar) for the data shown, to two decimal places 28.1 6.2 24.5 11.5 8.7 6.7 169 3.2
A: Measure of central tendency measures the central or average value of a dataset. There are different…
Q: You go out and collect the following estimates of earthworms / acre: 54,276 57,378 51,108 66,190…
A: Given, The degrees of freedom are df = n – 1 = 7 – 1 = 6
Q: Find the weighted average of these values. Value | Weight 7.00 75.0% 8.00 15.0% 9.00 10.0% weighted…
A: The weighted average (x) is equal to the sum of the product of the weight (w) times the data number…
Q: The margin of error for a 95% interval estimate for the population mean rental charge is, a 57.54…
A:
Q: 4. Write a short note on measures of dispersion with an example.
A: As per Bartleby guidelines, for more than one question asked, first is to be answered. Please upload…
i need help with B and C
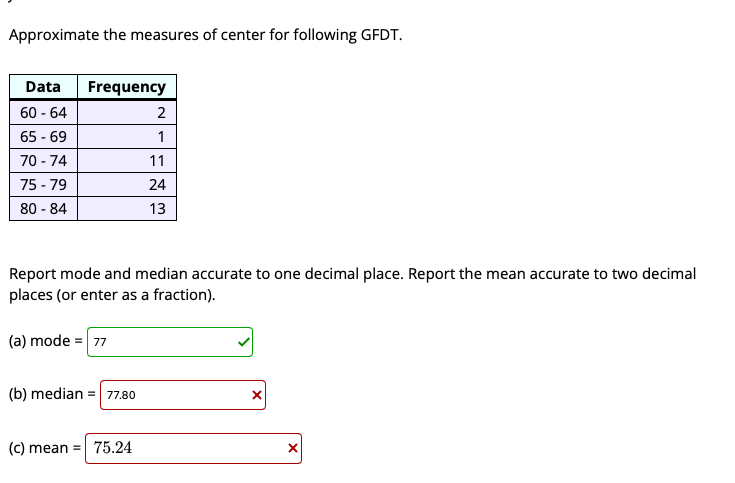
Trending now
This is a popular solution!
Step by step
Solved in 2 steps