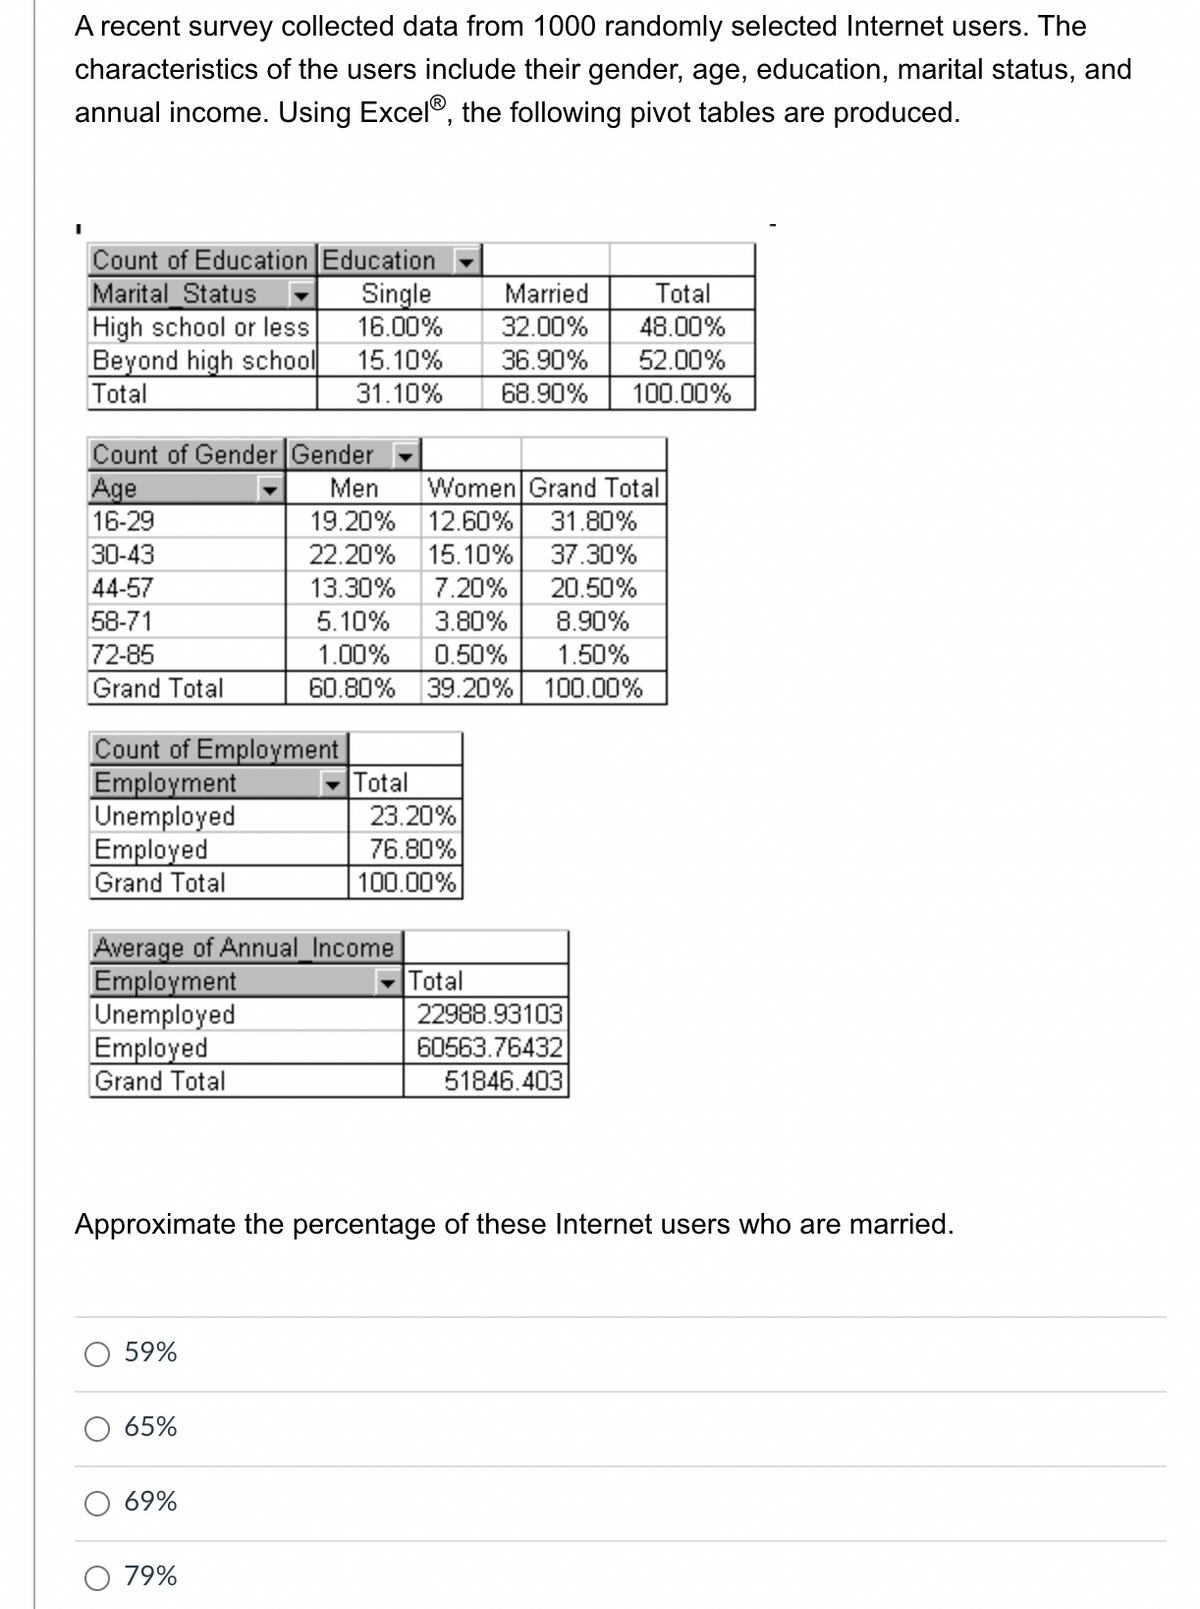
Approximate the percentage of these Internet users who are married.


Q: sB2 is a measure of ____.
A: sB2:The term sB2 is the variability between the sample means. The test statistic of F is the ration…
Q: Describe about the three positive relationships of Scatterplots?
A: Here's the explanation is as follows; A scatter plot is a type of graph that shows pairs of data…
Q: According to the American Wind Energy Association, wind energy operating capacity increased from…
A: You have asked multiple unrelated questions in the same post. I have addressed the first one. Please…
Q: Estimate, to the nearest tenth, the difference between the average number of awakenings during the…
A: Average number of awakenings during night for men 18 year old is 2.9 Average number of awakenings…
Q: The table summarizes results from 985 pedestrian deaths that were caused by automobile accidents.
A: Solution: The given table of data is
Q: When 345 HS students were surveyed, 125 said that they completed a driver's education class prior to…
A:
Q: Select all measures that will be affected if a student who is 77 inches tall joins the class.
A: Mean is the sum of the observation divided by the number of observation. Thus including the data…
Q: Understand how to calculate percentage changes.
A: Consider the following values: Initial value=10 Final value=13 Percentage change=Final value-Initial…
Q: Make a table showing the approximate values and the actual value, together with the percentage error
A: xy'=12x-3y..................1Let x=e2z=logxdzdx=1xdydx=dydz·dzdx ⇒dydz·1xxdydx=dydzNow equation (1)…
Q: find out he 78th percntile for given data 45,78,85,89,3,5,69,63,78
A:
Q: Estimate the measure of ZOPQ to the nearest 10°.
A: Estimate the angle nearest 10°.
Q: what is the approximate number of students taking the exam?
A: given: Grades follow Normal with u= 75 and σ= 8 12 students got more than 90.…
Q: Estimate how many times a dart will hit the new bull's eye if 50 darts hit the target, Round your…
A:
Q: If the base of a triangle is increased by 60%, find the percentage change in the height of the…
A:
Q: , find the percentage error in
A:
Q: Below are listed the prices of a Toyota brand vehicde by years Year price 2013 20000 2014 24000 2015…
A: Given data, X Y X*Y X*X 2013 20000 40260000 4052169 2014 24000 48336000 4056196 2015…
Q: Find an estimates of the average number of accidents per week in two different junctions.
A: Here given, Speed cameras (SC) are used to reduce the risk of accidents in accident-prone zones in…
Q: The median annual salary of police officer was 384,000 pesos. If the 25th percentile for the annual…
A: GIven, Median = 384000 25th percentile of annual salary = 282525 To find, P (282525 < X…
Q: Here are the ages (in years) of 8 professors at a college. 32, 46, 29, 37, 57, 28, 34, 42 What is…
A:
Q: A boutique wants to determine how the amount of time a customer spends browsing in the store affects…
A: It is given that the A scatter plot between the Amount spent (in dollars) and the Browsing time (in…
Q: The mean age of a combined group of men and women is 30 years. If the mean age of the group of men…
A:
Q: A new bridge reduced the normal 35-minutes travel time between two cities by 14 minutes. What…
A: Given information Original amount of time=35 minutes Reduce amount of time=14 minutes We have to…
Q: if the whale is 48 feet is it an outlier?
A: here use basic of Normal distribution
Q: identify a column in the table with data at a ratio level
A: Here you've given that data for Reputations of 10 companies in the U.S. and it is as follows, And…
Q: Calculate a point estimate for the proportion of all MVCC students that have brown eyes. Do not…
A: A random sample eye colors collected from a group of 40 MVCC students are considered in which there…
Q: According to a survey, 59% of parents say their teens are addicted to using their cell phones. Write…
A: Given data is : 59% of parents say their teens are addicted to using their cell phones To write…
Q: Construct your own problem involving related rates.
A:
Q: Below is a box plot representing hours that teenagers spend on video games per week.
A: In box plot,
Q: find 56th percentile 101,110,112,116,114,113,105,106,107,114,106,108,107
A: From the given information we want to find the 56 the percentile.
Q: If 15 acres of a 100-acre forest is cut down, what percent of the forest has been lost due to it…
A: Given , If 15 acres of a 100-acre forest is cut down We have to find percent of the forest has been…
Q: The number 0.0078 has how many significant figures?
A: Concept: A branch of mathematics which deals with symbols and the rules for manipulating those…
Q: In a survey 300 adults were interviewed, 123 said they had yearly medical checkup. Find the 95% for…
A: Sample size is n = 300 Number of adults who had yearly medical checkup, X = 123 The critical value…
Q: What percent of tire treads will last between 26,000 and 32,000 miles?
A: Given data: The mean life is μ=30000 miles. The standard deviation is σ=2000 miles.
Q: The number of adults (in millions) using e-book devices is expected to climb in the years ahead. The…
A: Construct a table for solving x2, y2, xy and their sum using the equations∑xm+nb=∑y and ∑x2m+∑xb=∑xy
Q: For the past month, 60 new cases of a disease were added to an existing 540 cases. If 2500 people…
A: New cases = 60 Existing cases = 540 Total Cases = 600
Q: Recently, the annual number of driver deaths per 100,000 for the selected age groups was as lows:
A: Hello! As you have posted more than 3 sub parts, we are answering the first 3 sub-parts. In case…
Q: Identify the correct scatterplot that shows how backpack weight relates to body weight.
A: Answer: From the given data The scatter plot is
Q: find 10th pr for given data 45,85,98,7,56,78,56,34,25,96,85
A:
Q: The table below shows the number of cars (in millions) sold in the United States for various years…
A:
Q: what is the number of weeks the motion picture was in release?
A: Given Data : The above data is for Weeks in Release for all the movies
Q: If you spend 4 hours a week studying for English and 4.5 hours studying for math what is the ratio…
A: If spending 4 hours a week studying for English and 4.5 hours studying for math, to find what is the…
Q: find 1st pr for given data 45,85,98,7,56,56,32,56,78,56,34,25,96,85
A:
Q: If a quarterly seasonal index is 0.56, it implies that Multiple Choice the other three quarterly…
A: it implies that
Q: What is the fraction of deaths that happened before 2012?
A:
Q: Which orchard has the highest rate of apples per tree?
A: Here it is given that the three apple orchards and each orchard has a different number of trees and…
Q: A business serves 33 customers with 60 staff to maintain a strong ratio of staff to guests. How…
A:
Q: What percentage of this grid is shaded?
A: To find the percentage of the shaded grid
Q: According to www.internetworldstats.com, as of June 30,2014, North America has 310,322,257 of its…
A: Since, the percent of any number can be formulated as follows:

Step by step
Solved in 2 steps with 1 images

- How will marketers change their social media use in the near future? A survey by Social Media Examiner reported that 77% of B2B marketers (marketers that focus primarily on attracting businesses) plan to increase their use of LinkedIn, as compared to 54% of B2C marketers (marketers that primarily target consumers). The survey was based on 1,184 B2B marketers and 1,703 B2C marketers. The following table summarizes the results: Give an example of a simple Give an example of a joint What is the complement of a marketer who plans to increase use of LinkedIn? Why is a marketer who plans to increase use of LinkedIn and is a B2C marketer a joint event?In 2010, the U.S. Congress passed the historic health care reform bill that will provide some type of coverage for the 32 million Americans currently without health care insurance. Just how widespread is the lack of medical coverage? The media claim that the segments of the population most at risk for disease and thus needing healthcare are women, children, the elderly and the poor. The following tables were generated from the U.S. Census Bureau, Current Population Survey, Annual Social and Economic Supplement (2011). The tables report the number of uninsured (in thousands) by sex, by age, and by household income. Is being insured or not dependent on gender? Fill in the degrees of freedom and p-value in the output below and draw a clear conclusion indicating which gender is more at risk of not being insured if there is a significant difference.In 2010, the U.S. Congress passed the historic health care reform bill that will provide some type of coverage for the 32 million Americans currently without health care insurance. Just how widespread is the lack of medical coverage? The media claim that the segments of the population most at risk for disease and thus needing healthcare are women, children, the elderly and the poor. The following tables were generated from the U.S. Census Bureau, Current Population Survey, Annual Social and Economic Supplement (2011). The tables report the number of uninsured (in thousands) by sex, by age, and by household income Is being insured or not dependent on the age groups identified in the analysis? Fill in the degrees of freedom and p-value in the output below and draw a clear conclusion indicating which age-groups are more at risk of not being insured if there is a significant relationship
- In 2010, the U.S. Congress passed the historic health care reform bill that will provide some type of coverage for the 32 million Americans currently without health care insurance. Just how widespread is the lack of medical coverage? The media claim that the segments of the population most at risk for disease and thus needing healthcare are women, children, the elderly and the poor. The following tables were generated from the U.S. Census Bureau, Current Population Survey, Annual Social and Economic Supplement (2011). The tables report the number of uninsured (in thousands) by sex, by age, and by household income Is being insured or not dependent on the income groups identified in the analysis? Fill in the degrees of freedom and p-value in the output below and draw a clear conclusion indicating which income-groups are more at risk of not being insured if there is a significant relationship.In 2010, the U.S. Congress passed the historic health care reform bill that will provide some type of coverage for the 32 million Americans currently without health care insurance. Just how widespread is the lack of medical coverage? The media claim that the segments of the population most at risk for disease and thus needing healthcare are women, children, the elderly and the poor. The following tables were generated from the U.S. Census Bureau, Current Population Survey, Annual Social and Economic Supplement (2011). Explain using supportive arguments from your analyses. Write a general summary paragraph identifying groups lacking in coverage by gender, age and income and commenting on the headline. Reference the observed numbers and percentages in your summary paragraph to see how the groups trend in identifying potentially more at-risk. Analysises for reference: Is being insured or not dependent on gender? Fill in the degrees of freedom and p-value in the output below and draw…Which group has the largest number of data points?
- The U.S. Census Bureau serves as the leading source of quantitative data about the nation’s people and economy. The following crosstabulation shows the number of households (1000s) and the household income by the highest level of education for the head of household (U.S. Census Bureau website, 2013). Only households in which the head has a high school diploma or more are included. Highest level of Education Under$25,000 $25,000 to $49,999 $50,000 to $99,999 $100,000 and over Total High school graduate 9880 9970 9441 3482 32,773 Bachelor's degree 2484 4164 7666 7817 22,131 Master's degree 685 1205 3019 4094 9003 Doctoral degree 79 160 422 1076 1737 Total 13,128 15,499 20,548 16,469 65,644 a. Develop a joint probability table.b. What is the probability of the head of one of these households having a master’s degree or more education?c. What is the probability of a household headed by someone with a high school diploma earning $100,000 or more?d. What is the probability…If a group of data 4,6,3,8,5,5,9,10, and 30 were gathered, which will be the best torepresent the average?The file MidCity Download MidCitycontains data on 128 recent sales in Mid City. For each sale, the file shows the neighborhood (1, 2, or 3) in which the house is located, the number of offers made on the house, the square footage, whether the house is made primarily of brick, the number of bathrooms, the number of bedrooms, and the selling price. Neighborhoods 1 and 2 are more traditional neighborhoods, whereas neighborhood 3 is a newer, more prestigious neighborhood. Home Nbhd Offers Sq Ft Brick Bedrooms Bathrooms Price 1 2 2 1790 No 2 2 228600 2 2 3 2030 No 4 2 228400 3 2 1 1740 No 3 2 229600 4 2 3 1980 No 3 2 189400 5 2 3 2130 No 3 3 239600 6 1 2 1780 No 3 2 229200 7 3 3 1830 Yes 3 3 303200 8 3 2 2160 No 4 2 301400 9 2 3 2110 No 4 2 238400 10 2 3 1730 No 3 3 208000 11 2 3 2030 Yes 3 2 265000 12 2 2 1870 Yes 2 2 246000 13 1 4 1910 No 3 2 205200 14 1 5 2150 Yes 3 3 252600 15 3 4 2590 No 4 3 353600 16 3 1 1780 No 4 2 291600 17 2 4 2190 Yes 3 3…
- Set up a spreadsheet simulation model in which whether Atlanta wins each game is arandom variable.Some research has shown that older parents are not as strict when disciplining their children compared to younger parents. Children of older parents are more likely to be in daycare and have greater independence than children of younger parents, whereas children of younger parents are more likely to be at home with parents and other siblings, and encounter more home discipline. A researcher observed the disciplinary habits of 456 families with at least one child, categorizing each as "high" or "low" in terms of disciplinary strictness. The families were also divided into older parents (those 29 years of age or younger) and older parents (30 years old and up). Are the following data consistent with the hypothesis that older parents are not as strict when disciplining their children? Calculate gamma and interpret it's direction and magnitude, and summarize your findings in a few sentences. Level of discipline Parental age 29 years or younger 30 years or…Each week the Wall Street Journal and Harris Interactive track the opinions and experiences of college recruiters for large corporations and summarize the results in the Business School Survey. Data have been gathered for the top 10 business schools from a list of 76 and is summarized below. Please complete the questions below and upload this document and your EXCEL document to the portal in CANVAS. School Ranking Enrollment (# of full-time students) Annual Tuition ($) Mean GMAT % with Job Offer Average Salary ($) Dartmouth 1 503 38,400 704 89 119,800 Michigan 2 1873 33,076 690 91 105,986 Carnegie Mellon 3 661 38,800 691 93 95,531 Northwestern 4 2650 38,844 700 94 117,060 Yale 5 468 36,800 696 86 104,018 Pennsylvania 6 1840 40,458 716 92 117,471 California Berkeley 7 1281 21,512 701 92 112,699 Columbia 8 1796 38,290 709 95 126,319 North…