The table below shows the number of cars (in millions) sold in the United States for various years and the percent of those cars manufactured by GM.

Holt Mcdougal Larson Pre-algebra: Student Edition 2012
1st Edition
ISBN:9780547587776
Author:HOLT MCDOUGAL
Publisher:HOLT MCDOUGAL
Chapter7: Percents
Section7.4: The Percent Equation
Problem 28E
icon
Related questions
icon
Concept explainers
Topic Video
Question

The table below shows the number of cars (in millions) sold in the United States for
various years and the percent of those cars manufactured by GM.
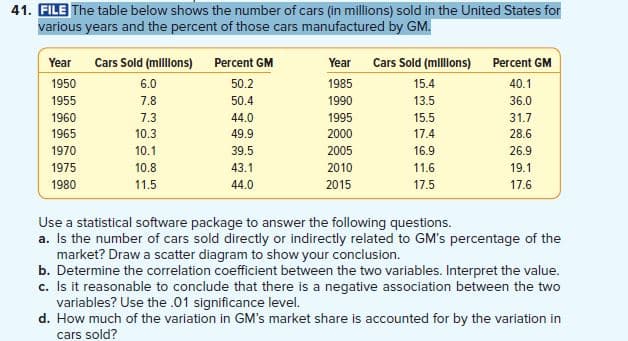
41. FILE The table below shows the number of cars (in millions) sold in the United States for
various years and the percent of those cars manufactured by GM.
Year
Cars Sold (mllons) Percent GM
Year Cars Sold (mllons)
Percent GM
1950
6.0
50.2
1985
15.4
40.1
1955
7.8
50.4
1990
13.5
36.0
1960
7.3
44.0
1995
15.5
31.7
1965
10.3
49.9
2000
17.4
28.6
1970
10.1
39.5
2005
16.9
26.9
1975
10.8
43.1
2010
11.6
19.1
1980
11.5
44.0
2015
17.5
17.6
Use a statistical software package to answer the following questions.
a. Is the number of cars sold directly or indirectly related to GM's percentage of the
market? Draw a scatter diagram to show your conclusion.
b. Determine the correlation coefficient between the two variables. Interpret the value.
c. Is it reasonable to conclude that there is a negative association between the two
variables? Use the .01 significance level.
d. How much of the variation in GM's market share is accounted for by the variation in
cars sold?
Transcribed Image Text:41. FILE The table below shows the number of cars (in millions) sold in the United States for various years and the percent of those cars manufactured by GM. Year Cars Sold (mllons) Percent GM Year Cars Sold (mllons) Percent GM 1950 6.0 50.2 1985 15.4 40.1 1955 7.8 50.4 1990 13.5 36.0 1960 7.3 44.0 1995 15.5 31.7 1965 10.3 49.9 2000 17.4 28.6 1970 10.1 39.5 2005 16.9 26.9 1975 10.8 43.1 2010 11.6 19.1 1980 11.5 44.0 2015 17.5 17.6 Use a statistical software package to answer the following questions. a. Is the number of cars sold directly or indirectly related to GM's percentage of the market? Draw a scatter diagram to show your conclusion. b. Determine the correlation coefficient between the two variables. Interpret the value. c. Is it reasonable to conclude that there is a negative association between the two variables? Use the .01 significance level. d. How much of the variation in GM's market share is accounted for by the variation in cars sold?
Expert Solution
trending now

Trending now

This is a popular solution!

steps

Step by step

Solved in 2 steps with 4 images

Blurred answer
Knowledge Booster
Application of Algebra
Learn more about
Need a deep-dive on the concept behind this application? Look no further. Learn more about this topic, statistics and related others by exploring similar questions and additional content below.
Recommended textbooks for you
Holt Mcdougal Larson Pre-algebra: Student Edition…
Algebra
ISBN:
9780547587776
Author:
HOLT MCDOUGAL
Publisher:
HOLT MCDOUGAL
Glencoe Algebra 1, Student Edition, 9780079039897…
Algebra
ISBN:
9780079039897
Author:
Carter
Publisher:
McGraw Hill