Approximate Total Number of Participants Needed for 80% Power for the Chi-Square Test for Independence for Testing Hypotheses at the 0.05 Significance Level Effect Size Total df Small Medium Large 1 785 87 26 2 964 107 39 3 121 1,090 1,194 44 4 133 48
Approximate Total Number of Participants Needed for 80% Power for the Chi-Square Test for Independence for Testing Hypotheses at the 0.05 Significance Level Effect Size Total df Small Medium Large 1 785 87 26 2 964 107 39 3 121 1,090 1,194 44 4 133 48

MATLAB: An Introduction with Applications
6th Edition
ISBN:9781119256830
Author:Amos Gilat
Publisher:Amos Gilat
Chapter1: Starting With Matlab
Section: Chapter Questions
Problem 1P

Related questions
Question
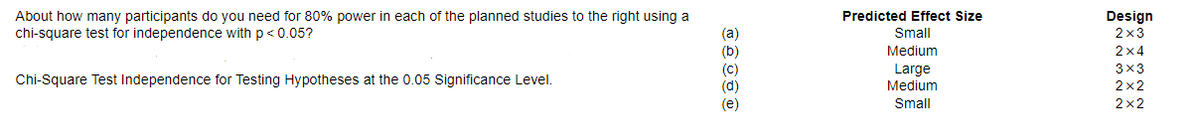
Transcribed Image Text:About how many participants do you need for 80% power in each of the planned studies to the right using a
chi-square test for independence with p< 0.05?
Predicted Effect Size
Design
2x3
Small
(a)
(b)
(c)
(d)
(е)
Medium
2x4
Large
3x3
Chi-Square Test Independence for Testing Hypotheses at the 0.05 Significance Level.
Medium
2x2
Small
2x2
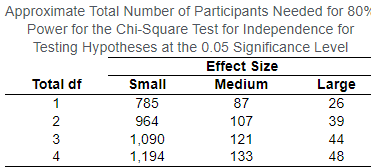
Transcribed Image Text:Approximate Total Number of Participants Needed for 80%
Power for the Chi-Square Test for Independence for
Testing Hypotheses at the 0.05 Significance Level
Effect Size
Total df
Small
Medium
Large
1
785
87
26
2
964
107
39
3
121
1,090
1,194
44
4
133
48
Expert Solution
This question has been solved!
Explore an expertly crafted, step-by-step solution for a thorough understanding of key concepts.

This is a popular solution!

Trending now
This is a popular solution!

Step by step
Solved in 4 steps with 4 images

Recommended textbooks for you
MATLAB: An Introduction with Applications
Statistics
ISBN:
9781119256830
Author:
Amos Gilat
Publisher:
John Wiley & Sons Inc

Probability and Statistics for Engineering and th…
Statistics
ISBN:
9781305251809
Author:
Jay L. Devore
Publisher:
Cengage Learning

Statistics for The Behavioral Sciences (MindTap C…
Statistics
ISBN:
9781305504912
Author:
Frederick J Gravetter, Larry B. Wallnau
Publisher:
Cengage Learning
MATLAB: An Introduction with Applications
Statistics
ISBN:
9781119256830
Author:
Amos Gilat
Publisher:
John Wiley & Sons Inc
Probability and Statistics for Engineering and th…
Statistics
ISBN:
9781305251809
Author:
Jay L. Devore
Publisher:
Cengage Learning
Statistics for The Behavioral Sciences (MindTap C…
Statistics
ISBN:
9781305504912
Author:
Frederick J Gravetter, Larry B. Wallnau
Publisher:
Cengage Learning

Elementary Statistics: Picturing the World (7th E…
Statistics
ISBN:
9780134683416
Author:
Ron Larson, Betsy Farber
Publisher:
PEARSON

The Basic Practice of Statistics
Statistics
ISBN:
9781319042578
Author:
David S. Moore, William I. Notz, Michael A. Fligner
Publisher:
W. H. Freeman

Introduction to the Practice of Statistics
Statistics
ISBN:
9781319013387
Author:
David S. Moore, George P. McCabe, Bruce A. Craig
Publisher:
W. H. Freeman