AQ-Q plot (or quantile-quantile plot) draws the correlation between a given sample and the normal distribution. It is used to check visually if the given the data follows the normal distribution. Suppose a Q-Q plot is given below: 40 20 theoretical What is the correct interpretation of the Q-Q plot? I. As all the points fall approximately along this reference line, we cannot assume normality. II. As all the points fall approximately along this reference line, we can assume normality. III. As some of the points fall approximately along this reference line, we cannot assume normality. IV. As some of the points fall approximately along this reference line, we can assume normality. a. I only b. П only с. Ш only d. IV only В sample
AQ-Q plot (or quantile-quantile plot) draws the correlation between a given sample and the normal distribution. It is used to check visually if the given the data follows the normal distribution. Suppose a Q-Q plot is given below: 40 20 theoretical What is the correct interpretation of the Q-Q plot? I. As all the points fall approximately along this reference line, we cannot assume normality. II. As all the points fall approximately along this reference line, we can assume normality. III. As some of the points fall approximately along this reference line, we cannot assume normality. IV. As some of the points fall approximately along this reference line, we can assume normality. a. I only b. П only с. Ш only d. IV only В sample

Glencoe Algebra 1, Student Edition, 9780079039897, 0079039898, 2018
18th Edition
ISBN:9780079039897
Author:Carter
Publisher:Carter
Chapter10: Statistics
Section10.4: Distributions Of Data
Problem 20PFA

Related questions
Question
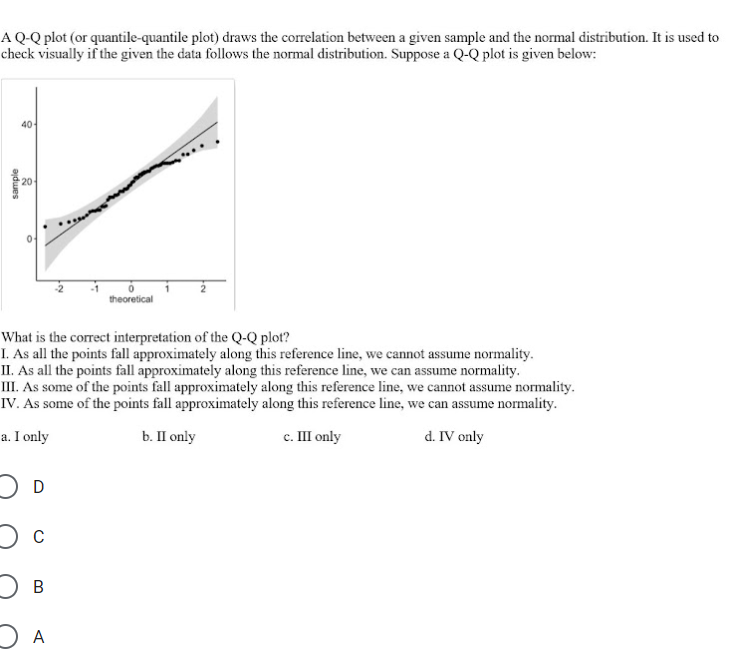
Transcribed Image Text:A Q-Q plot (or quantile-quantile plot) draws the correlation between a given sample and the normal distribution. It is used to
check visually if the given the data follows the normal distribution. Suppose a Q-Q plot is given below:
40
20
theoretical
What is the correct interpretation of the Q-Q plot?
I. As all the points fall approximately along this reference line, we cannot assume normality.
II. As all the points fall approximately along this reference line, we can assume normality.
III. As some of the points fall approximately along this reference line, we cannot assume normality.
IV. As some of the points fall approximately along this reference line, we can assume normality.
a. I only
b. П only
с. Ш only
d. IV only
A
sample
Expert Solution
This question has been solved!
Explore an expertly crafted, step-by-step solution for a thorough understanding of key concepts.

Step by step
Solved in 2 steps

Recommended textbooks for you
Glencoe Algebra 1, Student Edition, 9780079039897…
Algebra
ISBN:
9780079039897
Author:
Carter
Publisher:
McGraw Hill
Glencoe Algebra 1, Student Edition, 9780079039897…
Algebra
ISBN:
9780079039897
Author:
Carter
Publisher:
McGraw Hill