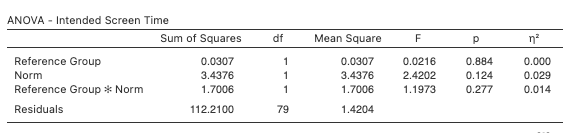
Are any of these results significant?


Q: Which of these two research objectives may be addressed using Chi-Square test of independence?
A: Chi square test of independence is used to determine whether two variables are dependent or not.
Q: Based on the data provided, the sensitivity of the new test is Question 2 The specificity of the new…
A: Here make contingency table
Q: Compute the x² value (test statistic) for this scenario.
A: here from given table complete the table with row total and column total for Against Row…
Q: A healthcare provider notices an outbreak of foodborne illness among individuals who attended a…
A:
Q: Question 6 ( The null hypothesis is not rejected at a significance level of 0.05. Therefore the null…
A: Rejection criteria:- • When calculated p-value is less than or equal to significance level, you…
Q: An estimator for parameter v is consistent if E(v) is close to v when sample size is increased.…
A: Given If E(v) is close to parameter v, the estimator is consistent.
Q: For each of the studies presented below: (1) Define the population parameter of interest to the…
A: The parameter is the characteristics or measure based on whole population.
Q: Part 2 of 3 (b) Assume that a histogram for the sample is bell-shaped. Between what two values will…
A:
Q: We can make a causal claim from the results of the chi-square test ? tru or false
A: False
Q: An investigator collected the following data with respect to the Corona virus cases and death in the…
A: It is given that the data about the Corona cases and deaths in United State America.
Q: Based on the data provided by the Environmental Protection Agency (EPA) in New York, we are…
A: State the null and alternative hypotheses for the above research question.
Q: When does z test is said to be accurate?
A: A z-test is a statistical test used to determine whether two population means are different when the…
Q: Hypothesis testing on samples with fewer than 30 participants can be carried out by using the…
A: We know that if a sample size greater than or equal to 30 to be large for which we use the z test.…
Q: The following graphs are the results of the Statistical Process Control (SPC). Are they classified…
A: Yes, the results of the Statistical Process Control (SPC) are in-control. Because all the points…
Q: When we use a least-squares line to predict y values for x values beyond the range of x values…
A: Since we were using the data to predict y beyond the range of x values , we had be extrapolating the…
Q: Question 5 True/False: ANOVA tests are directional and it is possible to conclude that one mean is…
A: 5.
Q: Researchers claim that use of excess fish affects the performance of brain. To test the hypothesis…
A: From the provided information, Sample size (n) = 15 The mean and standard deviation of the data…
Q: Identify and discuss the several aspects of univariate analysis.
A: Univariate analysis is the simplest form of analyzing a data.
Q: cite three instances that will prove that experimental research is more accurate, and reliable.
A: Prooving That experimental research is more accurate, and reliable
Q: If we went ahead and used parametric statistics, even though our usual assumptions were NOT met,…
A: If parametric statistics are used even though the assumptions are not met, we will get unreliable…
Q: In an attempt to measure the effects of acid rain, researchers measured the pH (7 is neutral and…
A:
Q: There is a claim that drink driving has been very common in high ways. The Highway Police randomly…
A:
Q: urvey of 64 families yields the following data for the number of children per f 1 1 2 2 3 4 5 1 2 3…
A: From the available information, 8 0' represents 8 families contains no children. 11 1's represents…
Q: Historically, the proportion of people who trade in their old car to a car dealer when purchasing a…
A:
Q: Is this a valid experimental design?
A: Here student want to check fertilizer affect the plant growth
Q: How do we find the gamma and the p-value to evaluate the hypothesis that people who are more…
A: Given information: The output for the association test is given.
Q: In order to study the amount of saving and income of two populations of employees (boys and girls),…
A: 1) Two hypothesises can be formulated for comparing two populations. I) H0: There is no significant…
Q: Derive the mean and he variance of X ~ Beta Ca, f).
A:
Q: What is the z-score if mu = 89 , sigma=11.5, and x = 82 ?
A: Given: μ=89 , sigma=11.5, and x=82 Z- score is calculated according to the following formula, z=x-μσ…
Q: Scenario 4: Does sustained sensory deprivation have any effect on the alpha-wave patterns in the…
A: Statistical tests are used to calculate the test statistic and p-value. This test statistic and…
Q: Consider the bivariate data shown in the table. 10 12 13 14 15 16 х 11 У 10.8 4.8 2.9 9.3 8.6 7.7…
A: From the given information, x y 8 10.8 9 9.3 10 8.6 11 7.7 12…
Q: Outline the components of the classical experimental design. How is it different from a one-group…
A: Pre-test/Post-test control group design This is also called the classic controlled experimental…
Q: Which of these significance levels will lead to a rejection of the Ho?
A: Given that Sample size n = 100 Sample mean = 11.5 Population SD = 2
Q: If the value of Cronbach’s alpha is 0.07, it means ___________;
A: It is an important part of statistics. It is widely used.
Q: The formula for total variance (SST) is
A: Solution:-
Q: In an attempt to measure the effects of acid rain, researchers measured the pH (7 is neutral and…
A: Five number summary,Box and Whisker Plots…
Q: QUESTION 8 STAT1000E2twopopS2021.pdf The owner of a service station wants to determine if owners of…
A: For the given small sample size (i.e n<30) with the population standard deviation unknown, we…
Q: question (9): A researcher was interested in the effect of job security on stress. The researcher…
A: Given a situation on job security and stress. We have to write the statement is true or false.
Q: Question 2b Following the information in 2a, calculate the test statistics (F value) and find…
A: Given: Sample size n1 = 7 Sample size n2 = 8 Sample standard deviation S1 = 2800 Sample standard…
Q: Scenario 3 Runner Music No Music 1 535 468 2 531 449 528 482 524 571 4 5 433 562 496 592 7 555 471 8…
A: We have given that Two dependent samples Motivational music(X) and No music (Y) with same sample…
Q: esults from a civil servant exam are shown in the table to the right. Is there sufficient evidence…
A: Solution: The observed frequency table is Passed Failed Row Total White candidates 15 18…
Q: QUESTION 19 Results that are significant indicate that the data has proven your hypothesis. True O…
A: From the given information in question We answer the correct option
Q: Can I use CRONBACH’S ALPHA in testing the reliability of the device? How?
A: CRONBACH's Alpha: It is a measure of internal consistency. Cronbach alpha can be considered as a…
Q: The results V significantly V so there sufficient evidence to support the claim that most adults…
A: Here you are given that claim Most adults would not erase all of their personal information online…
Q: In an observational study it was found that people who had received the flu shot this year had…
A: Given info: In an observational study it was found that people who had received the flu shot this…
Q: QUESTION 5 Formulate the indicated conclusion in nontechnical terms. Be sure to address the original…
A:
Q: The
A: Design of experiment
Q: QUESTION 9 An alternate hypothesis is a statement that is accepted if the sample data provide…
A: Here AS PER POLICY I HAVE CALCULATED FIRST MAIN QUESTION ONLY PLZ REPOST FOR REMAINING HERE Use…
Q: Question 13. Let X be a random variable with variance 4. Also, let Y be another ran- dom variable…
A:
Are any of these results significant?

Step by step
Solved in 4 steps

- What is a sample space?A lawyer received a complaint from a factory workers somewhere in Pampanga. The workers claimed that the were being forced to work for more than 8 hours. 8 hours is the average/normal work time per day in the Philippines as stated in the Labor Code and was initially stipulated by their employer when they were hired. They also reported that they were not receiving any compensation for their overtime work. The lawyer commissioned you to conduct a survey involving 10 randomly selected workers from the factory to inquire about their work time. The data you collected is displayed below. 8 hours 6 hours 5 hours 10 hours 14 hours 3 hours 9 hours 8 hours 11 hours 14 hours Use the P-Value Approach in testing the complaint of the workers. a. Estimate μ at 99% confidence interval. b. Did you find support for the rep’s claim? Why/not? c. Based on your findings, would you advice the lawyer to take the case? Why/not? d. If you drew the wrong conclusion and gave the labor lawyer the wrong…According to the Pew Research Center,on the propotion of the American population who use only a cellular telephone (landline) is 0.37. Jason conducts a survey of one hundred fifty 20 to 24 year olds who live on their own and finds that 73 do not have a landline to their home. Does this provide sufficient evidence to conclude that the proportion of 20 to 24 year olds who live on their own and don't have a landline is greater than 0.37? Use a=0.10 level of significance. A) Verify that nP0(1-P0)>10 and n< 0.05N (Assume the population sizes is N=40 million) B) State the appropiate null and alternative hypotheses. C) Indicate whether the hypothesis is left, right, or two- tailed.
- According to the Pew Research Center,on the propotion of the American population who use only a cellular telephone (landline) is 0.37. Jason conducts a survey of one hundred fifty 20 to 24 year olds who live on their own and finds that 73 do not have a landline to their home. Does this provide sufficient evidence to conclude that the proportion of 20 to 24 year olds who live on their own and don't have a landline is greater than 0.37? Use a=0.10 level of significance. D) Compute the test statistic z0. Round to the nearest hundredth. E) Draw a normal model with the area that represents the P-value shaded. F) Determine and interpret the P-value. What is the conclusion of the hypothesis test?A lawyer received a complaint from a representative for factory workers somewhere in Pampanga. The workers were being forced to work for more than 8 hours. 8 hours is the average/normal work time per day in the Philippines as stated in the Labor Code and was initially stipulated by their employer when they were hired. They also reported that they were not receiving any compensation for their overtime work. The lawyer commissioned you to conduct a survey involving 10 randomly selected workers from the factory to inquire about their work time. The data you collected is displayed below. 8 hours 6 hours 5 hours 10 hours 14 hours 3 hours 9 hours 8 hours 11 hours 14 hours Use the P-Value Approach in testing the complaint of the workers. 1) Estimate μ at 99% confidence interval. 2) If you drew the wrong conclusion and gave the labor lawyer the wrong advice, what type of error would you have committed?What is pythagrom theriom
- Federal law under Title 49 of the United States Code, Chapter 301, Motor Vehicle Safety Standard took effect on January 1, 1968 and required all vehicles (except buses) to be fitted with seat belts in all designated seating positions. While most states have laws requiring seat belt use today, some people still do not “buckle up.” Let’s assume that 90 % of drivers do “buckle up.” If drivers are randomly stopped to check seat belt usage, answer the following questions and show your work. If they stop 30 cars during the first hour, find the mean and standard deviation of the number of drivers not expected to be wearing seatbelts? If they stop 120 cars during this safety check, what is the probability they find at least 12 drivers not wearing seatbelts?The National Claims History (NCH) contains records for 999,645 Medicare patients who were discharged from acute care hospitals in October 2008. The Department of Health and Human Services performed a detailed audit of adverse medical events on a random sample of 780 drawn at random without replacement by assigning a random number to each patient on the list and then choosing random integers between 1 and 999,645. (a) What kind of sample is this (random, systematic, stratified, cluster)? (b) Is this population effectively infinite?The annual salary for a sample of U.S. governors in 2017 are as follows: $120395, $177467, $130273, $139339, $177412, $99636, $150000, $159300, $123427, $108167, $149730, $110834, $105000, $142265, $148886, $98600, $106078, $109470, $160135, $175000, $150000, $105000. 1. Find the mean and the standard deviation for the sample of annual salaries. 2. What is the associated t - score for a 99% confidence level? 3. What is the margin of error for a confidence level of 99%? 4. Find a 99% confidence interval for the mean salary of U.S. governors in 2017. Assume the data is normally distributed.
- Male Female26,801 21,39217,251 25,0384,624 4,47927,801 18,27024,555 10,6637,767 17,11020,536 10,77916,516 19,98425,601 14,05620,948 18,51912,153 17,70311,382 11,30813,138 17,00723,568 25,14217,874 5,616102 17,63120,292 24,5689,701 16,93722,178 15,53116,189 12,88517,664 30,97022,418 6,5195,993 18,3335,899 6,10424,563 10,00311,655 17,88411,600 12,35514,317 20,13011,649 21,96117,427 13,33914,658 35,76910,205 10,68520,063 9,15415,219 11,99611,846 30,61614,723 20,53517,184 16,2678,686 17,89917,833 20,14113,345 14,90014,770 19,1535,386 11,94719,548 16,55313,755 18,12515,959 30,23816,800 38,61218,987 24,75439,299 33,12517,677 25,55947,062 32,94627,391 20,46511,298 5,18615,815 25,02111,590 14,5586,579 15,67619,395 28,9542.) The Gallup organization surveyed 1100 adult Americans on May 6-9, 2002, and conducted an independentsurvey of 1100 adult Americans on May 8-11, 2014. In both surveys they asked, “Right now, do you think the stateof moral values in the country as a whole is getting better or getting worse?” On May 8-11, 2014, 816 of the 1100of the survey responded that the state of moral values is getting worse; on May 6-9, 2002, 737 of 1100 surveyedresponded that the state of moral values is getting worse. Is there a significant difference between the twoproportions at the ? = 0.1 level of significance?a.) Verify that the requirements for inference about two population proportions is satisfied.b.) What is the Null and Alternative Hypotheses? What test will you be using?c.) What is the level of significance and the ?-value?A mayor running for re-election claims that during his term, average municipal taxes have fallen by $100. A conscientious statistician wants to test this claim. He surveys 44 of his neighbors and finds that their taxes decreased (in dollars) as follows:50, 0, 67, 52, 207, 161, 159, 150, 95, 145, 84, 102, 69, 136, 109, 58, 125, 149, 145, 179, 126, 83, 132, 173, 109, 100, 162, 46, 49, 114, 89, 12, 239, 35, 114, 92, 27, 102, 90, 123, 122, 159, 138, 138The statistician assumes a population standard deviation of $48. Do you think the statistician should reject the mayor's claim? Why or why not?Step 1: State the hypothesis. Correct = CorrectStep 2: Determine the Features of the Distribution of Point Estimates Using the Central Limit Theorem.By the Central Limit Theorem, we know that the point estimates are Correct with distribution mean Incorrect100 and distribution standard deviation Incorrect7.2362722698663.Step 3: Assuming the Claim is True, Find the Probability of Obtaining the…