article included a classification of 91 home runs hit at a baseball stadium according to the direction that the ball was hit, resulting in the accompanying data. Left Center Right Center Right Field Direction Number of Home Runs Left Field 17 10 Center 7 20 37 LUSE SALT a) Assume that it is reasonable to regard this sample of 91 home runs as representative of home runs hit at the baseball stadium. Carry out a hypothesis test to determine if there is convincing evidence tha directions. Calculate the test statistic. (Round your answer to two decimal places.) x²
article included a classification of 91 home runs hit at a baseball stadium according to the direction that the ball was hit, resulting in the accompanying data. Left Center Right Center Right Field Direction Number of Home Runs Left Field 17 10 Center 7 20 37 LUSE SALT a) Assume that it is reasonable to regard this sample of 91 home runs as representative of home runs hit at the baseball stadium. Carry out a hypothesis test to determine if there is convincing evidence tha directions. Calculate the test statistic. (Round your answer to two decimal places.) x²

MATLAB: An Introduction with Applications
6th Edition
ISBN:9781119256830
Author:Amos Gilat
Publisher:Amos Gilat
Chapter1: Starting With Matlab
Section: Chapter Questions
Problem 1P

Related questions
Question
100%
helpppp
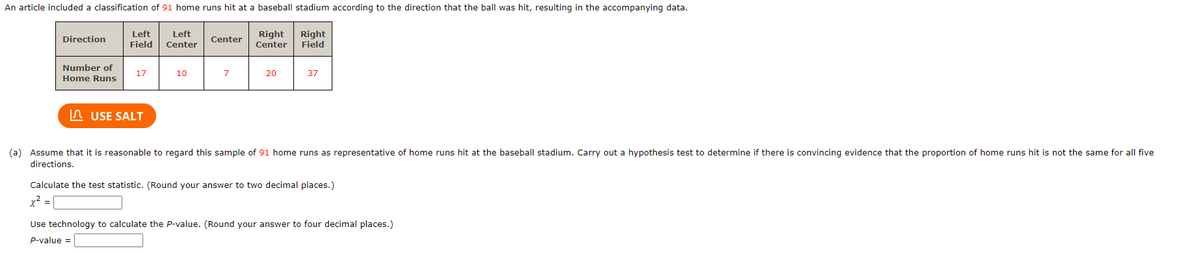
Transcribed Image Text:An article included a classification of 91 home runs hit at a baseball stadium according to the direction that the ball was hit, resulting in the accompanying data.
Right
Field
Direction
Number of
Home Runs
Left
Field
USE SALT
Left
Center
10
Center
Right
Center
20
37
(a) Assume that it is reasonable to regard this sample of 91 home runs as representative of home runs hit at the baseball stadium. Carry out a hypothesis test to determine if there is convincing evidence that the proportion of home runs hit is not the same for all five
directions.
Calculate the test statistic. (Round your answer to two decimal places.)
x² =
Use technology to calculate the P-value. (Round your answer to four decimal places.)
P-value =
Expert Solution
This question has been solved!
Explore an expertly crafted, step-by-step solution for a thorough understanding of key concepts.

This is a popular solution!

Trending now
This is a popular solution!

Step by step
Solved in 2 steps

Recommended textbooks for you
MATLAB: An Introduction with Applications
Statistics
ISBN:
9781119256830
Author:
Amos Gilat
Publisher:
John Wiley & Sons Inc

Probability and Statistics for Engineering and th…
Statistics
ISBN:
9781305251809
Author:
Jay L. Devore
Publisher:
Cengage Learning

Statistics for The Behavioral Sciences (MindTap C…
Statistics
ISBN:
9781305504912
Author:
Frederick J Gravetter, Larry B. Wallnau
Publisher:
Cengage Learning
MATLAB: An Introduction with Applications
Statistics
ISBN:
9781119256830
Author:
Amos Gilat
Publisher:
John Wiley & Sons Inc
Probability and Statistics for Engineering and th…
Statistics
ISBN:
9781305251809
Author:
Jay L. Devore
Publisher:
Cengage Learning
Statistics for The Behavioral Sciences (MindTap C…
Statistics
ISBN:
9781305504912
Author:
Frederick J Gravetter, Larry B. Wallnau
Publisher:
Cengage Learning

Elementary Statistics: Picturing the World (7th E…
Statistics
ISBN:
9780134683416
Author:
Ron Larson, Betsy Farber
Publisher:
PEARSON

The Basic Practice of Statistics
Statistics
ISBN:
9781319042578
Author:
David S. Moore, William I. Notz, Michael A. Fligner
Publisher:
W. H. Freeman

Introduction to the Practice of Statistics
Statistics
ISBN:
9781319013387
Author:
David S. Moore, George P. McCabe, Bruce A. Craig
Publisher:
W. H. Freeman