As a manager of a small software retailing company, you are concerned with projected profit next year. While profit can be determined as the difference between sales and maintenance cost, or in symbols, P = S - M, where P is profit, S is sales, and M is maintenance cost including technical support. It is argues that when sales goes up so does maintenance cost because the cost of technical support will go up. Further, it is measured that the correlation between S and M is 0.8. Now given the figure that sales next year is expected to be $300 thousand with standard deviation of $4 thousand and maintenance cost is expected to be $150 thousand with standard deviation of $6 thousand, what would be the expected profit and its standard deviation you will include in your report? Hint: This is a problem of two random variables.


Correlation
Correlation defines a relationship between two independent variables. It tells the degree to which variables move in relation to each other. When two sets of data are related to each other, there is a correlation between them.
Linear Correlation
A correlation is used to determine the relationships between numerical and categorical variables. In other words, it is an indicator of how things are connected to one another. The correlation analysis is the study of how variables are related.
Regression Analysis
Regression analysis is a statistical method in which it estimates the relationship between a dependent variable and one or more independent variable. In simple terms dependent variable is called as outcome variable and independent variable is called as predictors. Regression analysis is one of the methods to find the trends in data. The independent variable used in Regression analysis is named Predictor variable. It offers data of an associated dependent variable regarding a particular outcome.
As a manager of a small software retailing company, you are concerned with projected profit next year. While profit can be determined as the difference between sales and maintenance cost, or in symbols, P = S - M, where P is profit, S is sales, and M is maintenance cost including technical support. It is argues that when sales goes up so does maintenance cost because the cost of technical support will go up. Further, it is measured that the
Mean is the average value. It is also called expected value. Variance is the mean squared deviations from mean. For 2 variables, S and M and V= Variance, difference of variances is given by the following:
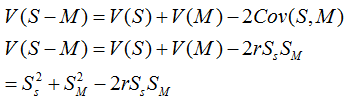
where,  ,r= correlation coefficient

Step by step
Solved in 2 steps with 3 images


