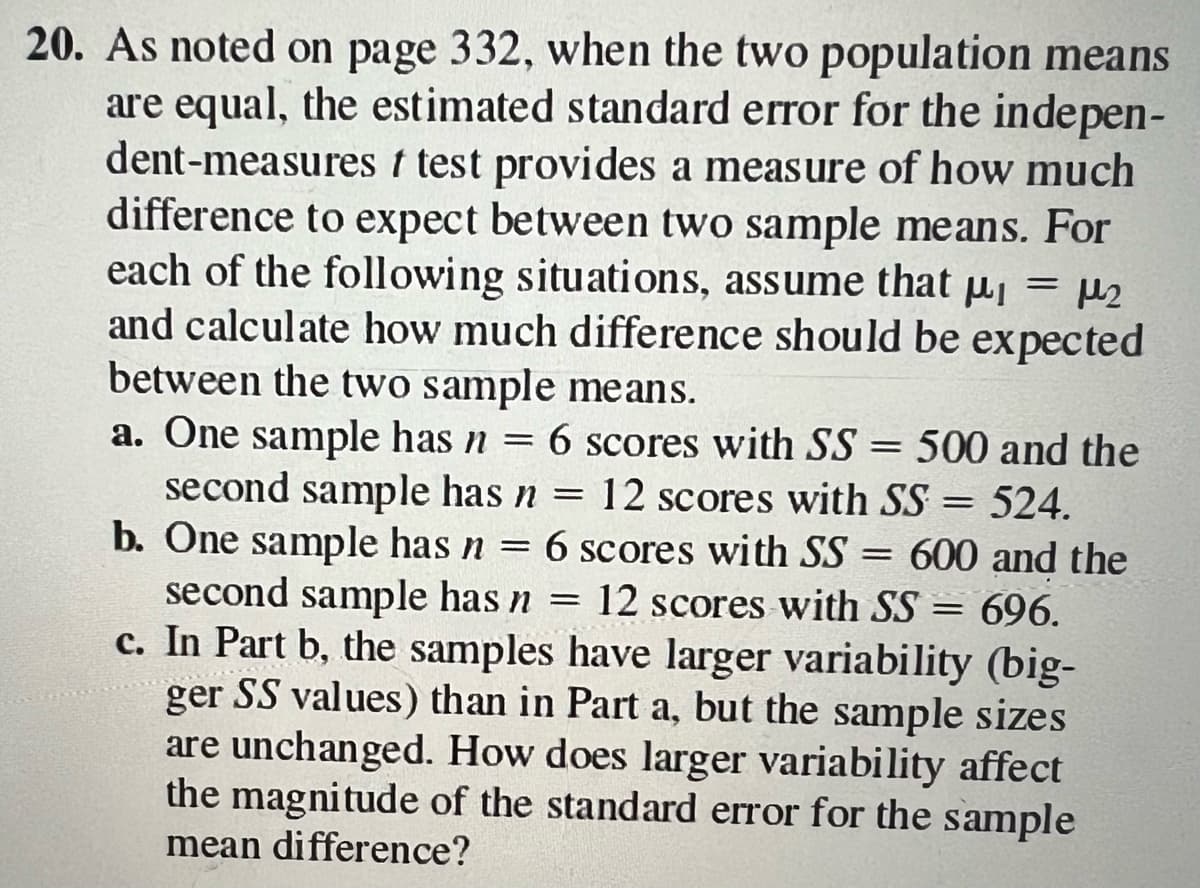
- As noted on page 332, when the two population means are equal, the estimated standard error for the indepen- dent-measures t test provides a measure of how much difference to expect between two sample means. For each of the following situations, assume that μ = μ2 and calculate how much difference should be expected between the two sample means. a. One sample has n = 6 scores with SS = 500 and the second sample has n = 12 scores with SS = 524. b. One sample has n = 6 scores with SS = 600 and the second sample has n = 12 scores with SS = 696. c. In Part b, the samples have larger variability (big- 91²² ger SS values) than in Part a, but the sample sizes are unchanged. How does larger variability affect the magnitude of the standard error for the sample mean difference?
- As noted on page 332, when the two population means are equal, the estimated standard error for the indepen- dent-measures t test provides a measure of how much difference to expect between two sample means. For each of the following situations, assume that μ = μ2 and calculate how much difference should be expected between the two sample means. a. One sample has n = 6 scores with SS = 500 and the second sample has n = 12 scores with SS = 524. b. One sample has n = 6 scores with SS = 600 and the second sample has n = 12 scores with SS = 696. c. In Part b, the samples have larger variability (big- 91²² ger SS values) than in Part a, but the sample sizes are unchanged. How does larger variability affect the magnitude of the standard error for the sample mean difference?

MATLAB: An Introduction with Applications
6th Edition
ISBN:9781119256830
Author:Amos Gilat
Publisher:Amos Gilat
Chapter1: Starting With Matlab
Section: Chapter Questions
Problem 1P

Related questions
Question
#20 on psych stats show full work
Transcribed Image Text:20. As noted on page 332, when the two population means
are equal, the estimated standard error for the indepen-
dent-measures t test provides a measure of how much
difference to expect between two sample means. For
each of the following situations, assume that p₁ = μ₂
and calculate how much difference should be expected
between the two sample means.
a. One sample has n = 6 scores with SS = 500 and the
second sample has n = 12 scores with SS = 524.
b. One sample has n = 6 scores with SS = 600 and the
second sample has n = 12 scores with SS = 696.
c. In Part b, the samples have larger variability (big-
ger SS values) than in Part a, but the sample sizes
are unchanged. How does larger variability affect
the magnitude of the standard error for the sample
mean difference?
Expert Solution
This question has been solved!
Explore an expertly crafted, step-by-step solution for a thorough understanding of key concepts.

This is a popular solution!

Trending now
This is a popular solution!

Step by step
Solved in 5 steps with 4 images

Recommended textbooks for you
MATLAB: An Introduction with Applications
Statistics
ISBN:
9781119256830
Author:
Amos Gilat
Publisher:
John Wiley & Sons Inc

Probability and Statistics for Engineering and th…
Statistics
ISBN:
9781305251809
Author:
Jay L. Devore
Publisher:
Cengage Learning

Statistics for The Behavioral Sciences (MindTap C…
Statistics
ISBN:
9781305504912
Author:
Frederick J Gravetter, Larry B. Wallnau
Publisher:
Cengage Learning
MATLAB: An Introduction with Applications
Statistics
ISBN:
9781119256830
Author:
Amos Gilat
Publisher:
John Wiley & Sons Inc
Probability and Statistics for Engineering and th…
Statistics
ISBN:
9781305251809
Author:
Jay L. Devore
Publisher:
Cengage Learning
Statistics for The Behavioral Sciences (MindTap C…
Statistics
ISBN:
9781305504912
Author:
Frederick J Gravetter, Larry B. Wallnau
Publisher:
Cengage Learning

Elementary Statistics: Picturing the World (7th E…
Statistics
ISBN:
9780134683416
Author:
Ron Larson, Betsy Farber
Publisher:
PEARSON

The Basic Practice of Statistics
Statistics
ISBN:
9781319042578
Author:
David S. Moore, William I. Notz, Michael A. Fligner
Publisher:
W. H. Freeman

Introduction to the Practice of Statistics
Statistics
ISBN:
9781319013387
Author:
David S. Moore, George P. McCabe, Bruce A. Craig
Publisher:
W. H. Freeman