As people age, daily stress and worry decrease and happiness increases, according to an analysis of 340,847 adults ages 18 to 85 in a certain country. The graphs show a portion of the research. Complete parts (a) and (b) below. 60- 50- 60- 40- 50- 40- (22,35) 30어 30 (62,23) E 20- 20- 10- 0- -> 10- 15 30 45 60 75 Age 22 62 Age ..... a. Find the slope of the line passing through the two points shown in the line graph. Express the slope as a decimal. - 0.3 (Round to one decimal place as needed.) b. Use the answer from part (a) to complete the statement. For each year of aging, the percentage of Americans reporting "a lot" of stress decreases by V %. The rate of change is % per value of m. age group. year of aging. percentage of stress. Percentage Reporting Stress Percentage Reporting Stress
As people age, daily stress and worry decrease and happiness increases, according to an analysis of 340,847 adults ages 18 to 85 in a certain country. The graphs show a portion of the research. Complete parts (a) and (b) below. 60- 50- 60- 40- 50- 40- (22,35) 30어 30 (62,23) E 20- 20- 10- 0- -> 10- 15 30 45 60 75 Age 22 62 Age ..... a. Find the slope of the line passing through the two points shown in the line graph. Express the slope as a decimal. - 0.3 (Round to one decimal place as needed.) b. Use the answer from part (a) to complete the statement. For each year of aging, the percentage of Americans reporting "a lot" of stress decreases by V %. The rate of change is % per value of m. age group. year of aging. percentage of stress. Percentage Reporting Stress Percentage Reporting Stress

Glencoe Algebra 1, Student Edition, 9780079039897, 0079039898, 2018
18th Edition
ISBN:9780079039897
Author:Carter
Publisher:Carter
Chapter10: Statistics
Section10.1: Measures Of Center
Problem 14PPS

Related questions
Question
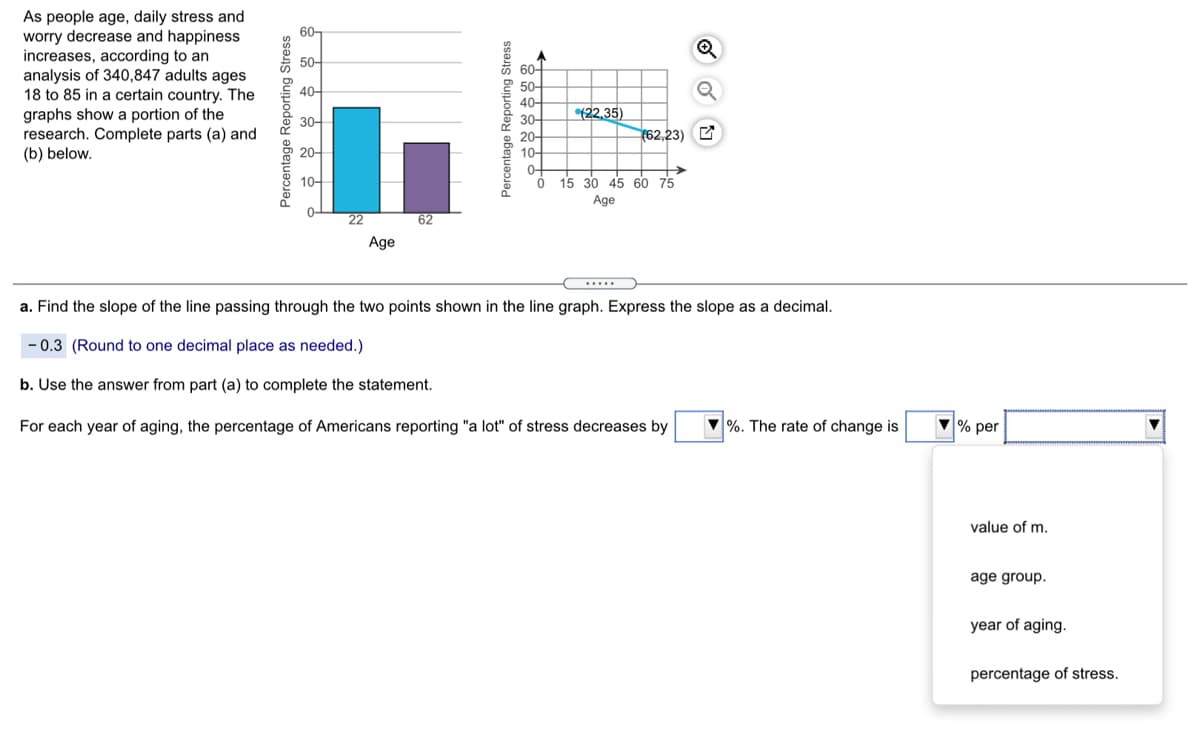
Transcribed Image Text:As people age, daily stress and
worry decrease and happiness
increases, according to an
analysis of 340,847 adults ages
18 to 85 in a certain country. The
graphs show a portion of the
research. Complete parts (a) and
(b) below.
60-
50-
604
2 50-
40-
40-
(22,35)
30-
30-
(62,23) E
20-
10-
0-
15 30 45 60 75
20-
10-
Age
22
62
Age
....
a. Find the slope of the line passing through the two points shown in the line graph. Express the slope as a decimal.
- 0.3 (Round to one decimal place as needed.)
b. Use the answer from part (a) to complete the statement.
For each year of aging, the percentage of Americans reporting "a lot" of stress decreases by
V %. The rate of change is
V% per
value of m.
age group.
year of aging.
percentage of stress.
Percentage Reporting Stress
Percentage Reporting Stress
Expert Solution
This question has been solved!
Explore an expertly crafted, step-by-step solution for a thorough understanding of key concepts.

Step by step
Solved in 2 steps with 2 images

Recommended textbooks for you
Glencoe Algebra 1, Student Edition, 9780079039897…
Algebra
ISBN:
9780079039897
Author:
Carter
Publisher:
McGraw Hill

Algebra: Structure And Method, Book 1
Algebra
ISBN:
9780395977224
Author:
Richard G. Brown, Mary P. Dolciani, Robert H. Sorgenfrey, William L. Cole
Publisher:
McDougal Littell
Glencoe Algebra 1, Student Edition, 9780079039897…
Algebra
ISBN:
9780079039897
Author:
Carter
Publisher:
McGraw Hill
Algebra: Structure And Method, Book 1
Algebra
ISBN:
9780395977224
Author:
Richard G. Brown, Mary P. Dolciani, Robert H. Sorgenfrey, William L. Cole
Publisher:
McDougal Littell