Bubble Plot of Internet vs ElderlyPop Bubble size: Rural Developed 90 1 2 80 3 70 60 50 40 30 20 10 0 0 10 ElderlyPop 20 15 Ln Internet


Inverse Normal Distribution
The method used for finding the corresponding z-critical value in a normal distribution using the known probability is said to be an inverse normal distribution. The inverse normal distribution is a continuous probability distribution with a family of two parameters.
Mean, Median, Mode
It is a descriptive summary of a data set. It can be defined by using some of the measures. The central tendencies do not provide information regarding individual data from the dataset. However, they give a summary of the data set. The central tendency or measure of central tendency is a central or typical value for a probability distribution.
Z-Scores
A z-score is a unit of measurement used in statistics to describe the position of a raw score in terms of its distance from the mean, measured with reference to standard deviation from the mean. Z-scores are useful in statistics because they allow comparison between two scores that belong to different normal distributions.
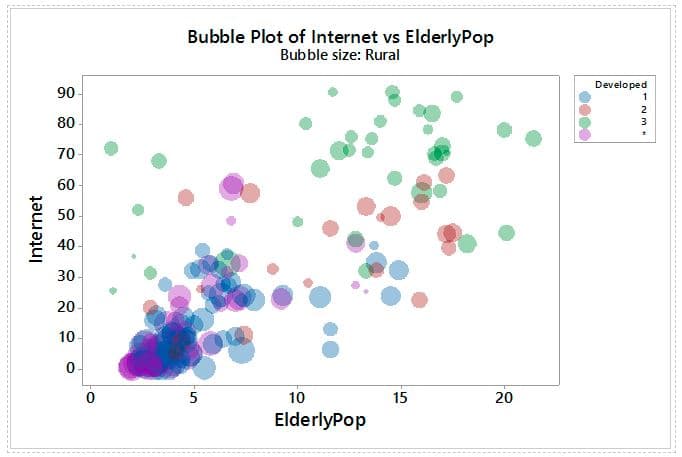
The graph shows information on four different variables for the countries of the world: The percent of the population to have access to the Internet, the percent of the population to be over 65 years old, the percent of the population to live in a rural setting, and how developed the country is (on a scale of 1, 2, 3).
For each of the four variables, indicate whether it is categorical or quantitative, and describe how it is displayed in the graph.


Trending now
This is a popular solution!

Step by step
Solved in 2 steps with 1 images


