bruary rch

Mathematics For Machine Technology
8th Edition
ISBN:9781337798310
Author:Peterson, John.
Publisher:Peterson, John.
Chapter37: Customary And Metric Gage Blocks
Section: Chapter Questions
Problem 21A

Related questions
Question
Explain what the graph shows
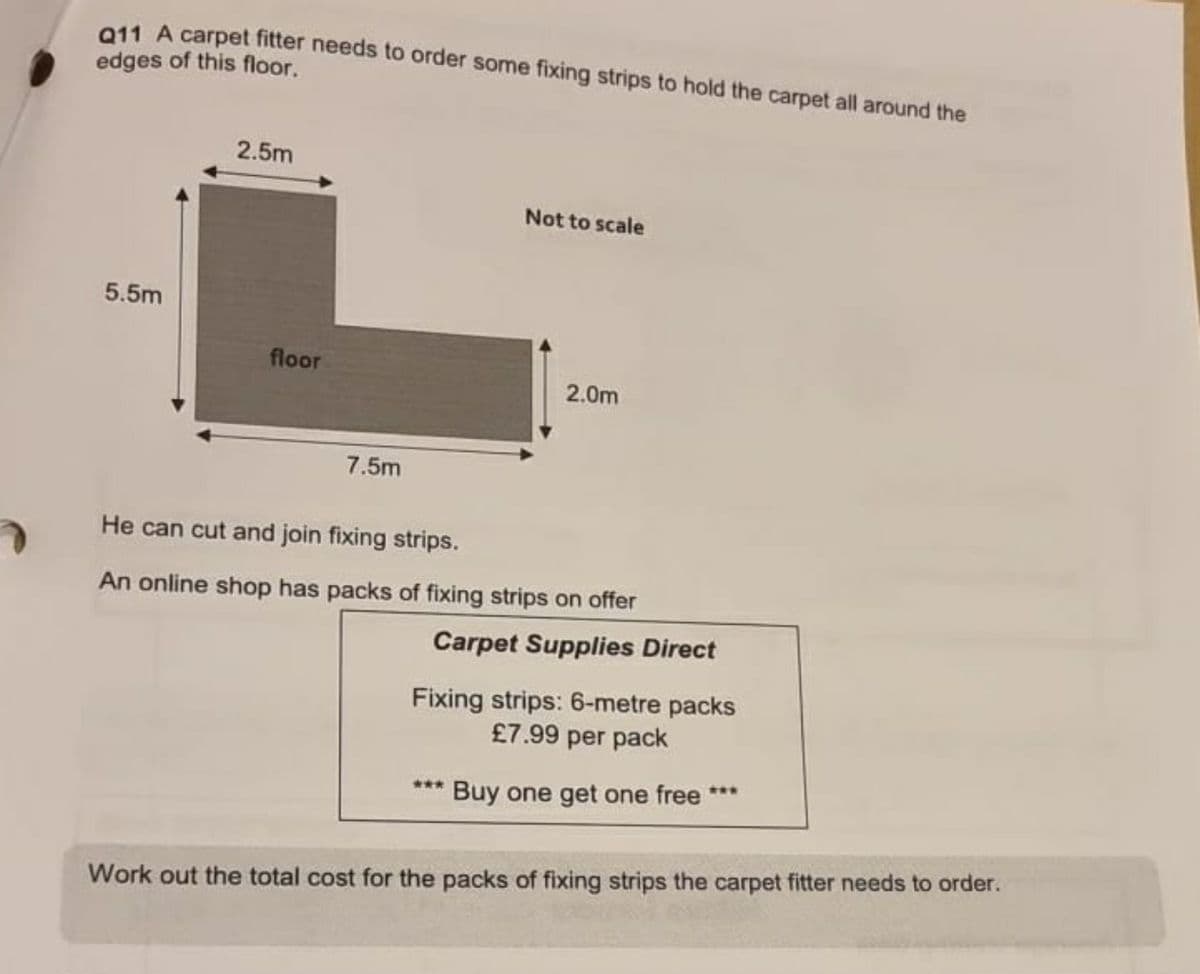
Transcribed Image Text:011 A carpet fitter needs to order some fixing strips to hold the carpet all around the
edges of this floor.
2.5m
Not to scale
5.5m
floor
2.0m
7.5m
He can cut and join fixing strips.
An online shop has packs of fixing strips on offer
Carpet Supplies Direct
Fixing strips: 6-metre packs
£7.99 per pack
**.
*** Buy one get one free
Work out the total cost for the packs of fixing strips the carpet fitter needs to order.
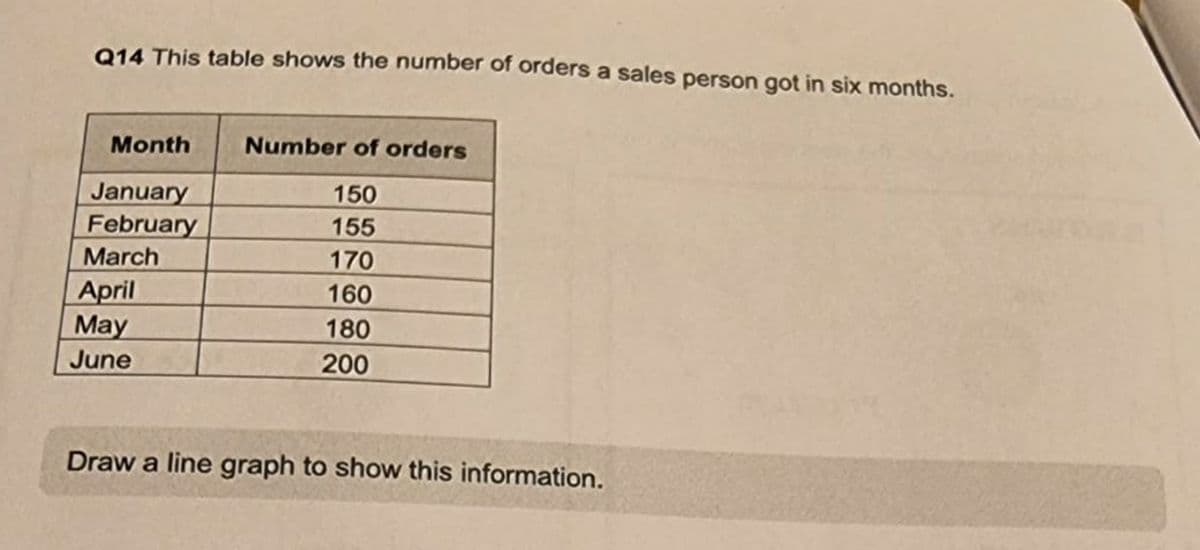
Transcribed Image Text:014 This table shows the number of orders a sales person got in six months.
Month
Number of orders
January
February
150
155
March
170
April
May
160
180
June
200
Draw a line graph to show this information.
Expert Solution
This question has been solved!
Explore an expertly crafted, step-by-step solution for a thorough understanding of key concepts.

Step by step
Solved in 3 steps with 1 images

Recommended textbooks for you
Mathematics For Machine Technology
Advanced Math
ISBN:
9781337798310
Author:
Peterson, John.
Publisher:
Cengage Learning,
Mathematics For Machine Technology
Advanced Math
ISBN:
9781337798310
Author:
Peterson, John.
Publisher:
Cengage Learning,