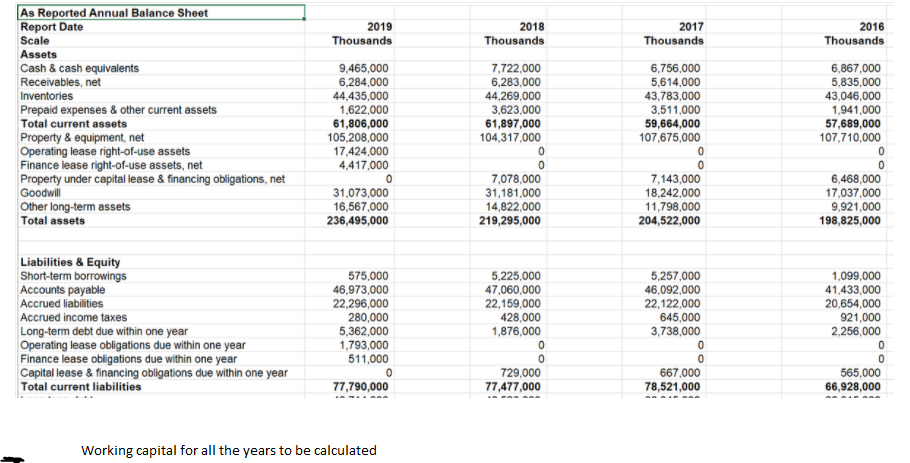
As Reported Annual Balance Sheet Report Date Scale Assets Cash & cash equivalents Receivables, net Inventories Prepaid expenses & other current assets Total current assets Property & equipment, net Operating lease right-of-use assets Finance lease right-of-use assets, net Property under capital lease & financing obligations, net Goodwill Other long-term assets Total assets Liabilities & Equity Short-term borrowings Accounts payable Accrued liabilities Accrued income taxes Long-term debt due within one year Operating lease obligations due within one year Finance lease obligations due within one year Capital lease & financing obligations due within one year Total current liabilities 2019 Thousands 9,465,000 6,284,000 44,435,000 1,622,000 61,806,000 105,208,000 17,424,000 4,417,000 0 31,073,000 16,567,000 236,495,000 575,000 46,973,000 22,296,000 280,000 5,362,000 1,793,000 511,000 0 77,790,000 Working capital for all the years to be calculated 2018 Thousands 7,722,000 6,283,000 44,269,000 3,623,000 61,897,000 104,317,000 7,078,000 31,181,000 14,822,000 219,295,000 5,225,000 47,060,000 22,159,000 428,000 1,876,000 0 729,000 77,477,000 2017 Thousands 6,756,000 5,614,000 43,783,000 3,511,000 59,664,000 107,675,000 7,143,000 18,242,000 11,798,000 204,522,000 5,257,000 46,092,000 22,122,000 645,000 3,738,000 0 0 667,000 78,521,000 2016 Thousands 6,867,000 5,835,000 43,046,000 1,941,000 57,689,000 107,710,000 0 6,468,000 17,037,000 9,921,000 198,825,000 1,099,000 41,433,000 20,654,000 921,000 2,256,000 0 565,000 66,928,000
As Reported Annual Balance Sheet Report Date Scale Assets Cash & cash equivalents Receivables, net Inventories Prepaid expenses & other current assets Total current assets Property & equipment, net Operating lease right-of-use assets Finance lease right-of-use assets, net Property under capital lease & financing obligations, net Goodwill Other long-term assets Total assets Liabilities & Equity Short-term borrowings Accounts payable Accrued liabilities Accrued income taxes Long-term debt due within one year Operating lease obligations due within one year Finance lease obligations due within one year Capital lease & financing obligations due within one year Total current liabilities 2019 Thousands 9,465,000 6,284,000 44,435,000 1,622,000 61,806,000 105,208,000 17,424,000 4,417,000 0 31,073,000 16,567,000 236,495,000 575,000 46,973,000 22,296,000 280,000 5,362,000 1,793,000 511,000 0 77,790,000 Working capital for all the years to be calculated 2018 Thousands 7,722,000 6,283,000 44,269,000 3,623,000 61,897,000 104,317,000 7,078,000 31,181,000 14,822,000 219,295,000 5,225,000 47,060,000 22,159,000 428,000 1,876,000 0 729,000 77,477,000 2017 Thousands 6,756,000 5,614,000 43,783,000 3,511,000 59,664,000 107,675,000 7,143,000 18,242,000 11,798,000 204,522,000 5,257,000 46,092,000 22,122,000 645,000 3,738,000 0 0 667,000 78,521,000 2016 Thousands 6,867,000 5,835,000 43,046,000 1,941,000 57,689,000 107,710,000 0 6,468,000 17,037,000 9,921,000 198,825,000 1,099,000 41,433,000 20,654,000 921,000 2,256,000 0 565,000 66,928,000
Financial Accounting: The Impact on Decision Makers
10th Edition
ISBN:9781305654174
Author:Gary A. Porter, Curtis L. Norton
Publisher:Gary A. Porter, Curtis L. Norton
Chapter10: Long-term Liabilities
Section: Chapter Questions
Problem 10.11E
Related questions
Question
8 )

Transcribed Image Text:As Reported Annual Balance Sheet
Report Date
Scale
Assets
Cash & cash equivalents
Receivables, net
Inventories
Prepaid expenses & other current assets
Total current assets
Property & equipment, net
Operating lease right-of-use assets
Finance lease right-of-use assets, net
Property under capital lease & financing obligations, net
Goodwill
Other long-term assets
Total assets
Liabilities & Equity
Short-term borrowings
Accounts payable
Accrued liabilities
Accrued income taxes
Long-term debt due within one year
Operating lease obligations due within one year
Finance lease obligations due within one year
Capital lease & financing obligations due within one year
Total current liabilities
2019
Thousands
9,465,000
6,284,000
44,435,000
1,622,000
61,806,000
105,208,000
17,424,000
4,417,000
0
31,073,000
16,567,000
236,495,000
575,000
46,973,000
22,296,000
280,000
5,362,000
1,793,000
511,000
77,790,000
Working capital for all the years to be calculated
0
2018
Thousands
7,722,000
6,283,000
44,269,000
3,623,000
61,897,000
104,317,000
0
7,078,000
31,181,000
14,822,000
219,295,000
5,225,000
47,060,000
22,159,000
428,000
1,876,000
0
0
729,000
77,477,000
2017
Thousands
6,756,000
5,614,000
43,783,000
3,511,000
59,664,000
107,675,000
7,143,000
18,242,000
11,798,000
204,522,000
5,257,000
46,092,000
22,122,000
645,000
3,738,000
0
0
667,000
78,521,000
2016
Thousands
6,867,000
5,835,000
43,046,000
1,941,000
57,689,000
107,710,000
0
0
6,468,000
17,037,000
9,921,000
198,825,000
1,099,000
41,433,000
20,654,000
921,000
2,256,000
0
0
565,000
66,928,000
Expert Solution
This question has been solved!
Explore an expertly crafted, step-by-step solution for a thorough understanding of key concepts.
Step by step
Solved in 2 steps with 1 images

Knowledge Booster
Learn more about
Need a deep-dive on the concept behind this application? Look no further. Learn more about this topic, accounting and related others by exploring similar questions and additional content below.Recommended textbooks for you

Financial Accounting: The Impact on Decision Make…
Accounting
ISBN:
9781305654174
Author:
Gary A. Porter, Curtis L. Norton
Publisher:
Cengage Learning

Financial And Managerial Accounting
Accounting
ISBN:
9781337902663
Author:
WARREN, Carl S.
Publisher:
Cengage Learning,

Managerial Accounting
Accounting
ISBN:
9781337912020
Author:
Carl Warren, Ph.d. Cma William B. Tayler
Publisher:
South-Western College Pub

Financial Accounting: The Impact on Decision Make…
Accounting
ISBN:
9781305654174
Author:
Gary A. Porter, Curtis L. Norton
Publisher:
Cengage Learning

Financial And Managerial Accounting
Accounting
ISBN:
9781337902663
Author:
WARREN, Carl S.
Publisher:
Cengage Learning,

Managerial Accounting
Accounting
ISBN:
9781337912020
Author:
Carl Warren, Ph.d. Cma William B. Tayler
Publisher:
South-Western College Pub