

Q: 15) Suppose we switch the base year from 2000 to 2008. This change in the base year will cause A)…
A: Standard national income predictions are frequently used to investigate the factors that influence…
Q: Select the graph above that best shows the change in the market specified in the following…
A: Select the graph above that best shows the change in the market specified in the following…
Q: You've collected the following information from your favorite financial website. 52-Week Price Lo…
A: The return that is necessary to achieve the objectives that the investor has determined to be most…
Q: Please solve them.
A: The Laffer curve illustrates the tax revenue at each possible level of tax rate. So, the Laffer…
Q: Data on fifth-grade test scores (reading and mathematics) for 420 school districts in California…
A: P-value is an important concept used widely in statistics and econometrics. It measures the…
Q: Question 1 erive the equation for and plot AFC(q), AVC(q), AC(q), and MC(q) for the following cost…
A:
Q: 4 Question 4 A firm has production function F(L,K) = LªK¹. Its capital is fixed at K = 1. Solve for…
A: Short run refers to that time interval in production for which some inputs are considered to be…
Q: From the economics information below Answer This QUESTION : what is the degree of price elasticity…
A: Price elasticity of demand (Ed) is a way to measure the responsiveness of the buyers of a service/…
Q: Johan has a clothing business. He made a bulk purchase of 1600 units of clothes from the local…
A: A settlement discount, also known as a cash discount, is a financial incentive presented by a seller…
Q: Question 39 Use the values in the table below to answer the following questions. Q TC ATC MC 3 20.48…
A: Total cost refers to the sum of all expenses incurred by a company in producing goods or providing…
Q: An effective price ceiling: A. Increases the quantity supplied. B. Is set above the equilibrium…
A: Price ceiling is a government-imposed price control on certain commodities. It is the maximum price…
Q: When estimating a short-run production function of the form Q = AL3 + BL2, it is necessary to…
A: The standard way to represent the cost function is in the cubic form. C= D+AL3+BL2Where D is the…
Q: Given C = 89 + 0.6Y, I = 100-150i, G = 20, Ms = 275, MD = 0.1Y+ 240-250i, derive the IS and LM…
A: The ISLM Model is an economic framework that depicts and analyzes the relationship between interest…
Q: The Dell computer company has two customers, Aleisha and Maria, for its desktop computers and…
A: Bundling within the realm of economics involves the practice of combining two or more products or…
Q: magine that in 2050, the dollar depreciates greatly against the euro. Use the ADAS model to explain…
A: Aggregate demand depicts an inverse relationship between the price,, 99, 254),, 99, 254); position:…
Q: No tables please, ONLY formulas
A: A repayment schedule, also known as an amortization schedule or loan repayment schedule, is a table…
Q: Due to technological advancements,the cost of producing electric cars has decreased…
A: Technological change is critical for a company to attain the best possible working environment. It…
Q: Use the Keynesian Model to answer this set of questions. Suppose that in the economy under…
A: The consumption function illustrates the connection between the overall income and the consumption…
Q: For each production function below, derive the long run cost function in terms of q, w, and r. 1.…
A: Long run cost function refers to that function which depicts the minimum level of cost which is…
Q: The table below shows national data for the economy of Westfall. Round your intermediate…
A: Inflation is the percentage in the value of the Wholesale Price Index on a year-to-year basis. It is…
Q: a. In the table provided below, calculate and enter either the interest rate that the bond would…
A: The rate at which the value of a loan or asset changes over time is known as its interest rate. The…
Q: Figure: A Profit-Maximizing Monopoly Firm Price, marginal revenue, marginal cost, average total cost…
A: Profit maximization refers to the strategy employed by a company to create the highest possible…
Q: How did Malaysia avoid the worst effects of the financial crisis in Southeast Asia? by opening its…
A: Financial crisis in southeast Asia was related to currency instability which hampered south east…
Q: If the target rate of interest is lower than the equilibrium interest rate, the Federal Reserve will…
A: The fiscal and monetary policies are used by the governments to achieve certain economic goals.…
Q: 240 220 200 180 160 140+ 120 100 80 60 40+ 20 Demand 5 10 15 20 25 30 35 40 45 50 55 60 Refer to…
A: A stable marketplace is where consumers successfully exchange goods and services through which…
Q: Given Q=100k0.5L0.5 , C=1200 w=30 r=40 (a)Determine the quantity of labour and capital the firm…
A: In case of production of two goods, a firm finds its equilibrium where the ratio of marginal product…
Q: 5 Question 5 A bottling company uses two inputs to produce bottles of the soft drink Dr Pibb;…
A: Given wage for labor w =$200rent of machine r =$800At current level of production, the marginal…
Q: The following graph plots the weekly market supply curve (orange line) for quiche in a hypothetical…
A: Producer surplus is difference between price seller is receiving and the price which he is willing…
Q: PRICE (Dollars per slice) 9.00 8.25 7.50 6.75 6.00 5.25 4.50 3.75 3.00 2.25 1.50 + 0.75 + 0 Price…
A: Producer surplus is difference between price seller is receiving and the price which he is willing…
Q: Upgraded fuel economy stnadards released in 2010 call for a 34.1 mile-per-gallon a verage for new…
A: It can be defined as the use or utilize any particular product or service in a given period of time…
Q: Analyse the macroeconomic factors relevant to Mīhī's launch strategy and the implications of such…
A: Macroeconomic factors cover broad economic elements that can influence a country's economy and in…
Q: (a)Draw a graph of the consumption function with respect to disposable income. Measure/show…
A: The consumption function shows the total income and consumption goods and services relationship in…
Q: Centipede's game: The following extensively described game is called the centipede's game: 99 II II…
A: Given gameIn a centipede game, two players take turns making decisions. The game is played along a…
Q: With the aid of appropriate diagrams, briefly explain the impact of a fiscal restraint under an…
A: Fiscal restraint refers to a deliberate policy action taken by a government to reduce its level of…
Q: Ketchup Corporation is currently trading at $40 per share. There are 0.5 million shares outstanding.…
A: When you invest money in the stock market than it is possible that you may get extra ordinary profit…
Q: A $1000 first year, then increasing $575 per year B C D $100 first year, then increasing $500 per…
A: We are provided with the initial and annual costs of 4 alternatives and we need to derive choice…
Q: Please no written by hand and no emage For a country, if we sum up its consumption, investment and…
A: Gross domestic product (GDP) measures the money value of all final goods and services produced in an…
Q: Price 80 7 6 1 A 05 10 15 20 25 30 35 40 45 50 55 60 65 Quantity per period Refer to the graph above…
A: Price ceiling refers to a type of price control. The price ceiling is the maximum price that can be…
Q: Consider the market for corn. The following graph shows the weekly demand for corn and the weekly…
A: The equilibrium price and equilibrium quantity of a good sold in the market are determined by the…
Q: The figure shows the marginal private cost curve, marginal social cost curve, and marginal social…
A: Market price : The market price is the current price at which a good or service can be purchased or…
Q: what happens in supply and demand when there is decrease in income tax but also an increase in sales…
A: It can be defined as a form of tax this tax is based on consumption and this tax is imposed by the…
Q: Consider a Ricardian framework with two countries, A and B, and two products, G1 and G2. The…
A: Someone has a comparative advantage if they can produce something for less money than anyone else.…
Q: Does the fact that public decisions are sometimes made by self-interested politicians and…
A: The part of an economy that is owned, controlled, and operated by the government or state entities…
Q: Refer to the diagram. Assume that nominal wages initially are set based on the price level P2 and…
A: Aggregate supply refers to the total quantity of goods and services that producers in an economy are…
Q: art A You are a banker to Livingstone Thompson Limited, a textile manufacturing company. Livingstone…
A: Net Present Value (NPV) = Present value of cash flows - Initial investmentNet Present Value (NPV) is…
Q: Section B Answer the question. Provide the detailed derivation for each answer. Consider the IS-LM…
A: DISCLAIMER “Since you have asked multiple questions, we will answer the first three questions for…
Q: A firm has the following total costs, where Q is output and TC is total cost: QTC0$…
A: The following table is provided that highlights the total quantity produced and the cost of…
Q: (2) Short Multiplier Questions a) Assume a city knows that its long-term income multiplier equals…
A: The income multiplier depicts the change in the GDP of the country due to an increase in investment.…
Q: A sports mortgage is the brainchild of Stadium Capital Financing Group, a company headquartered in…
A: Harold purchases the mortgage of $40,000 and buys the ticket for $290 for 50 years.The mortgage will…
Q: Q5. Demand is said to be elastic if (a) the price of the good responds substantially to changes in…
A: Demand is the total quantity of commodities for which the customers are ready to buy at different…

Step by step
Solved in 4 steps with 5 images


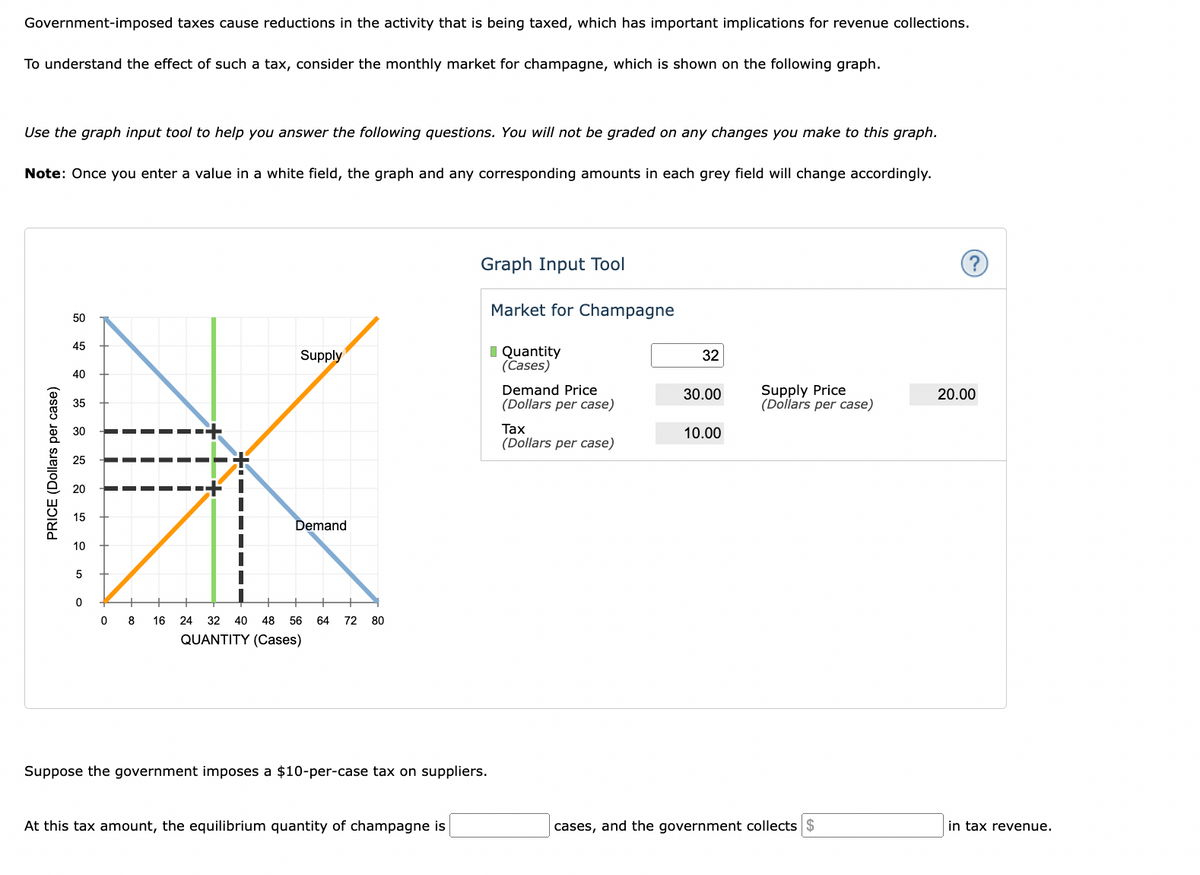
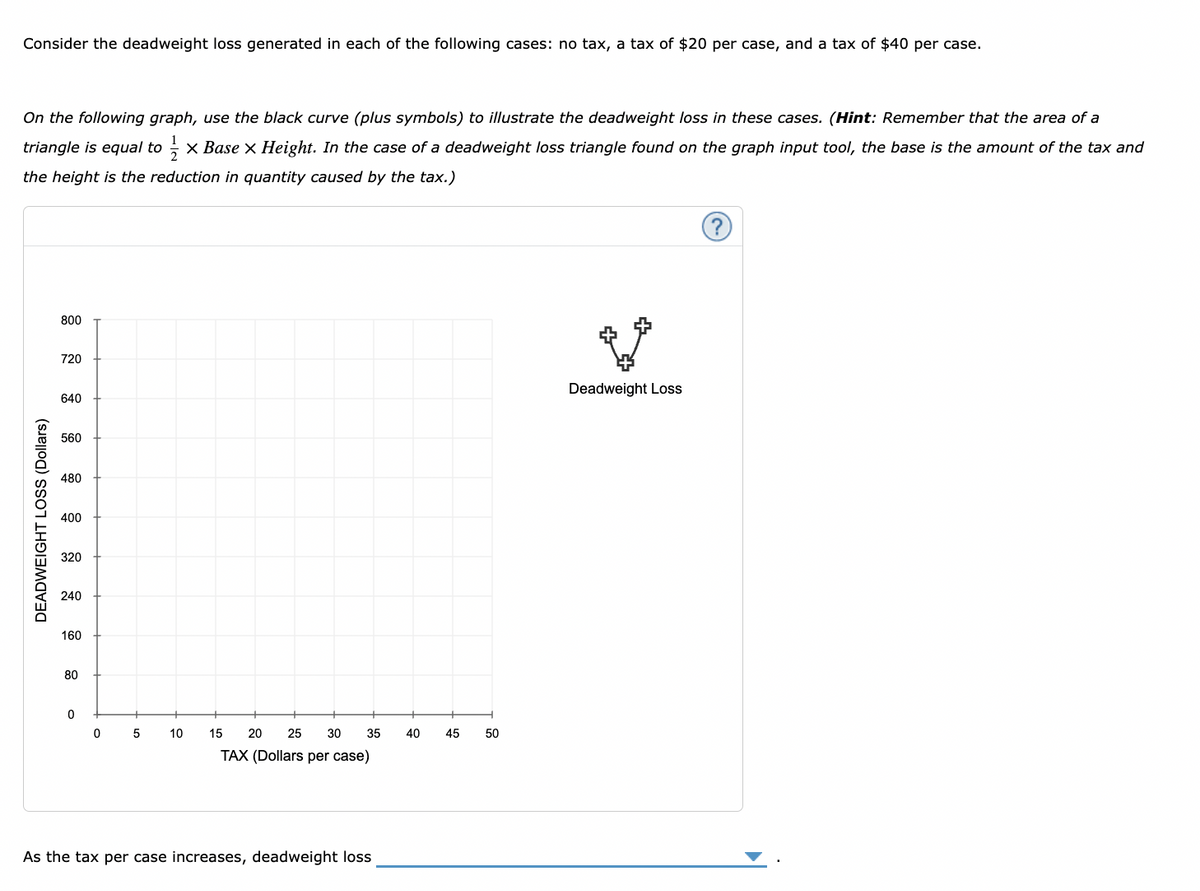
- The following graph shows the annual market for Florida oranges, which are sold in units of 90-pound boxes. Use the graph input tool to help you answer the following questions. You will not be graded on any changes you make to this graph. Note: Once you enter a value in a white field, the graph and any corresponding amounts in each grey field will change accordingly. 07014021028035042049056063070050454035302520151050PRICE (Dollars per box)QUANTITY (Millions of boxes)Demand Supply Graph Input Tool Market for Florida Oranges Price (Dollars per box) Quantity Demanded (Millions of boxes) Quantity Supplied (Millions of boxes) In this market, the equilibrium price is per box, and the equilibrium quantity of oranges is million boxes. For each of the prices listed in the following table, determine the quantity of oranges demanded, the quantity of oranges supplied, and the direction of pressure exerted on prices…The following graph shows the annual market for Michigan blueberries, which are sold in units of 50-pound boxes. Use the graph input tool to help you answer the following questions. You will not be graded on any changes you make to this graph. Note: Once you enter a value in a white field, the graph and any corresponding amounts in each grey field will change accordingly. 08016024032040048056064072080050454035302520151050PRICE (Dollars per box)QUANTITY (Millions of boxes)Demand Supply Graph Input Tool Market for Michigan Blueberries Price (Dollars per box) Quantity Demanded (Millions of boxes) Quantity Supplied (Millions of boxes) In this market, the equilibrium price is per box, and the equilibrium quantity of blueberries is million boxes. For each of the prices listed in the following table, determine the quantity of blueberries demanded, the quantity of blueberries supplied, and the direction of pressure…Government-imposed taxes cause reductions in the activity that is being taxed, which has important implications for revenue collections. To understand the effect of such a tax, consider the monthly market for gin, which is shown on the following graph. Use the graph input tool to help you answer the following questions. You will not be graded on any changes you make to this graph. Note: Once you enter a value in a white field, the graph and any corresponding amounts in each grey field will change accordingly. Suppose the government imposes a $20-per-bottle tax on suppliers. At this tax amount, the equilibrium quantity of gin is____ bottles, and the government collects_____ in tax revenue.
- Consider an economy in which an individual (A) is consuming two goods (X and Y). The government is considering two alternative taxation policies: (a) taxing good X; (b) putting a lump-sum tax on A. By using a graphical analysis, compare these two taxation policies in terms of excess burden.In the below graph, the white area in the upper left hand side represents 50% of the total area of the rectangle, the shaded area represents 27% of the area of the rectangle, and the white area in the lower right hand side represents 23% of the area in the rectangle. Based on this information, what is the Gini coefficient? Show your work.The following graph shows the labor market for research assistants in the fictional country of Academia. The equilibrium wage is $10 per hour, and the equilibrium number of research assistants is 250. Suppose the government has decided to institute a $4-per-hour payroll tax on research assistants and is trying to determine whether the tax should be levied on the employer, the workers, or both (such that half the tax is collected from each side). Use the graph input tool to evaluate these three proposals. Entering a number into the Tax Levied on Employers field (initially set at zero dollars per hour) shifts the demand curve down by the amount you enter, and entering a number into the Tax Levied on Workers field (initially set at zero dollars per hour) shifts the supply curve up by the amount you enter. To determine the before-tax wage for each tax proposal, adjust the amount in the Wage field until the quantity of labor supplied equals the quantity of labor demanded. You will not be…
- Advertising A small manufacturing firm collected the following data on advertising expenditures A (in thousands of dollars) and total revenue R (in thousands of dollars). (a) Draw a scatter diagram of the data. Comment on the type of relation that may exist between the two variables (b) The quadratic function of best fit to these data is R(A) = - 7.76A2 + 411.88A + 942.72 Use this function to determine the optimal level of advertising. (c) Use the function to predict the total revenue when the optimal level of advertising is spent. (d) Use a graphing utility to verify that the function given in part (b) is the quadratic function of best fit. (e) Use a graphing utility to draw a scatter diagram of the data, and then graph the quadratic function of best fit on the scatter diagram.I am stuck on this problem, I don't know where to start. Could you give a step by step on how to figure this problem out. Thank you. There is an increase in demand of 100 units at each price and a decrease in supply of 100 units at each price. In the graph below, draw the new demand and supply lines. Instructions: Use the graphing tools, 'D2', 'S2', to plot the new demand and supply lines on the figure and then use the grid lines to determine the new equilibrium price and quantity.Suppose initially that the United States is consuming 2 boots and 18 shirts and Canada is consuming 12 boots and 2 shirts, as indicated in the figure. Then, suppose the United States and Canada specialize by each only producing the good for which they have a comparative advantage and then trade. In particular, suppose the United States trades Canada half of its production for half of what Canada produces. The United States will have ? additional shirt(s) after the trade (enter a numeric response using an integer)
- Over the last several decades improvements in computer software, hardware and robotics have dramatically altered the ability of machines to do complex repetitive tasks. Discuss the implications for semi-skilled skilled workersas a result of this improvement. Discuss how the cost of the new technology influences the choice of inputs used in production and the rate of adoption of the new technology. Can you please answer this question so there will be no plagiarism, you have answer for this question in your website, but more likely it is already copied by someone elseTen years ago, the town of Easton decided to increase its annual spending on education so that its high school graduates would be able to earn higher wages. Now Easton has asked you to evaluate the effectiveness of the spending increase. Their data show that before the spending increase, the average annual salary of recent high school graduates was $25,000 and that now that average salary has risen to $28,500. Fortunately for your analysis, a neighboring community (Allentown) did not change its annual spending on education. Ten years ago, recent Allentown high school graduates earned an average of $22,500, and now that average is $23,750. (a) Use a difference-in-differences estimator to determine whether Easton’s spending increase caused the wages of their high school graduates to increase. (b) What underlying assumption do you have to make in order for your estimate to be valid? What might cause your underlying assumption to be invalid? (c) This data set contains only two…Based on the attached equation. Determine the following (a) Buyer’s price after tax(b) Seller’s Price after tax(c) Quantity after tax