ase “Heart.Disease”. The researcher wants to find which explanatory variable will be a better predictor of the response variable, “Heart.Disease”. Investigate the relationship between the explanatory variables and response variable to help the researcher find the better predictor. The dataset is called “Heart Disease.” Simple linear regression results:


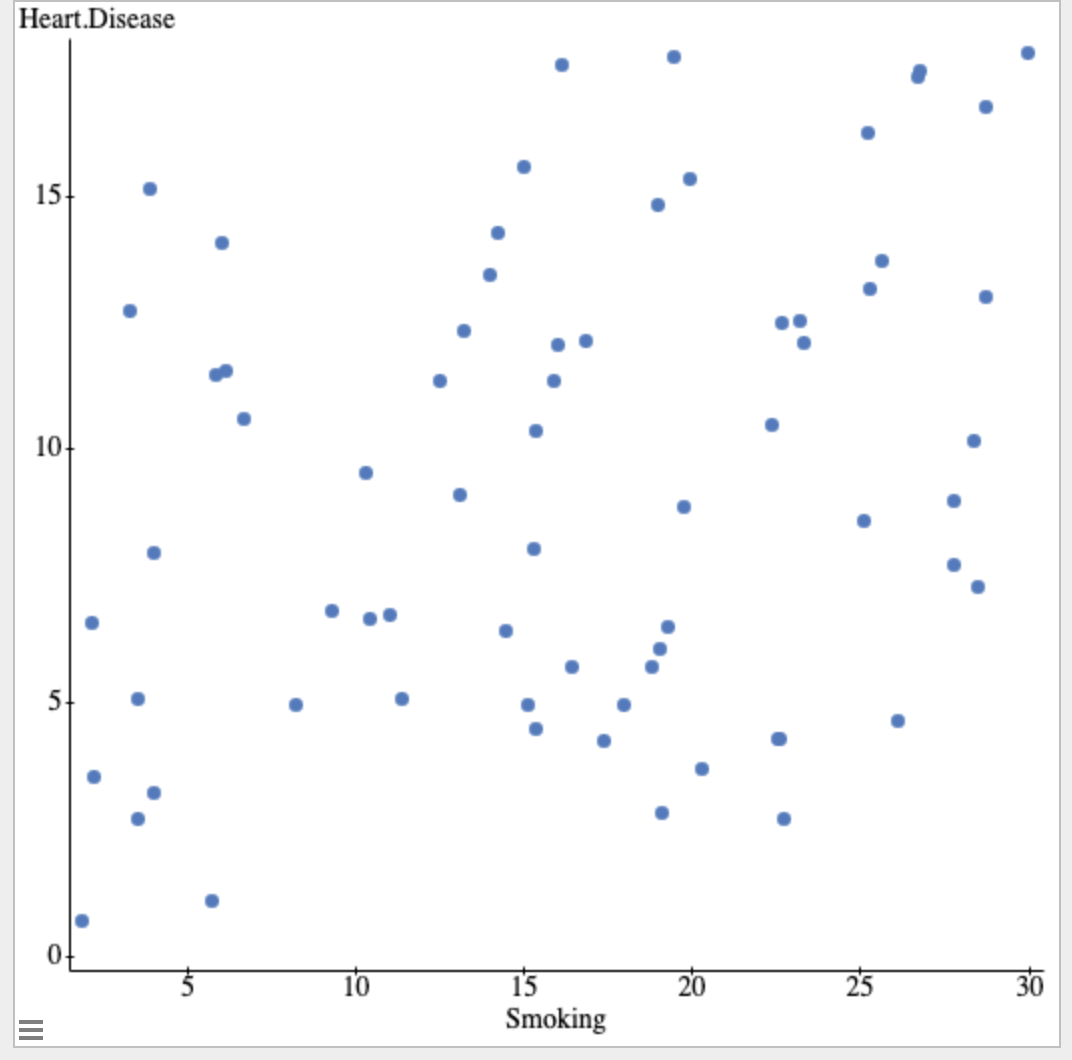
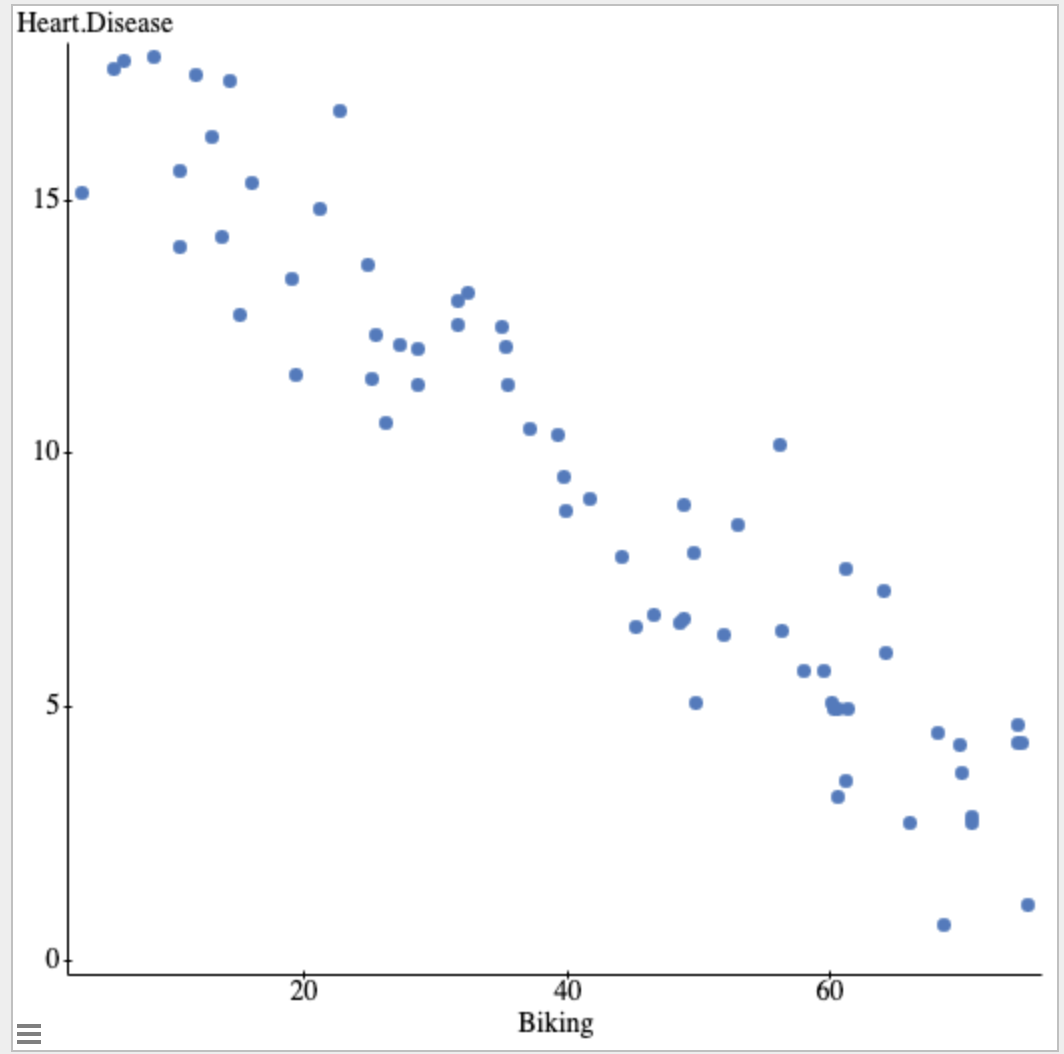
A public health researcher is interested in some factors that influence heart disease. In a survey of 68 randomly selected localities, he gathered data on the percentage of people in each locality who bike to work “Biking”, the percentage of people in each locality who smoke “Smoking”, and the percentage of people in each locality who have heart disease “Heart.Disease”. The researcher wants to find which explanatory variable will be a better predictor of the response variable, “Heart.Disease”. Investigate the relationship between the explanatory variables and response variable to help the researcher find the better predictor. The dataset is called “Heart Disease.”
Simple linear regression results:
Dependent Variable: Heart. Disease
Independent Variable: Biking
Heart. Disease = 18.115809 - 0.20845321 Biking
Sample size: 68
R (correlation coefficient ) = -0.94616452
R-sq = 0.8952273
Estimate of error standard deviation: 1.5273175
1) Which of the two explanatory variables would be the better predictor of “Heart.Disease”? Base your response on the scatterplots and the correlation coefficient. State your answer in one or two complete sentences including an explanation for your variable choice.
2) Interpret the slope of the regression line (in context of this data set) for “Biking” and “Heart.Disease”.
3) Is it meaningful to interpret the y-intercept for “Biking” and “Heart.Disease”? Why or why not?
4) State r2 (i.e., the coefficient of determination) for “Biking” and “Heart.Disease” and explain what this value means in context of the data set.


Trending now
This is a popular solution!

Step by step
Solved in 3 steps
