16 14 12 10 8 6. 4


Q: At Conner Company, a custom manufacturer of printed circuit boards, the finished boards are…
A: Given A = Poor electrolyte coverage B = Improper lamination C = Low copper plating D = Plating…
Q: Question 2 2.1 Solve the below problem (show all calculations). Let Y, and Y, be random variables…
A:
Q: Q3. The summary output obtained from fitting the multiple regression are given below. Coefficients…
A:
Q: The number of initial public offerings of stock issued in a Issues, x 424 457 695 500 499 37…
A: Use the Excel and Perform the Regression. Followings are the Steps to perform the Regression 1) Open…
Q: On the basis of the above information, construct a decision tree to facilitate the analvsis of this…
A:
Q: b) Now suppose that the same sample proportions came from a sample of 30 times as large. That is,…
A:
Q: The National Fire Incident Reporting Service stated that, among residential fires, 70% are in family…
A: For the given data Find the probability
Q: Example 16.14 The data on aptitude score and productivity index of six workers in a factory are…
A:
Q: A recent study of 85 workers found that 61 people rode the bus to work each day. Find the 95%…
A: Given that A recent study of 85 workers found that 61 people rode the bus to work each day. Find…
Q: b. What is the sampling distribution of the sample means given that the sample size is 2 which can…
A: Given Information: No. of observations=03Sample space={20,25,35}
Q: y your intermediate computations to at least three decimal places. (If necessary, consult a (a)…
A: According to the given information in this question According to bartleby we can answer three…
Q: In the twentieth century, it was a common practice in Southern California for houses to be built…
A: a) State the hypotheses. Null hypothesis: H0: pl=p2
Q: interval of the true standard deviation of the diameter of golf balls.
A: Here use confidence interval for population variance
Q: Mean and standard deviation of a distribution are 16 and 2 respectively. At least what percent of…
A:
Q: 2.6 Solve the below problem: Let Y, and Y2 have joint density function Se-Os+y2), f(y1»Y2) = {{o, Yı…
A:
Q: For an analysis of variance, "two-way" refers to the direction that traffic should follow on the…
A: In this case, we need to identify the correct option for the given statement.
Q: Describe the various components of the function Y, E(Y | X,) +4,. %3D
A: Hello! As you have posted 2 different questions, we are answering the first question. In case you…
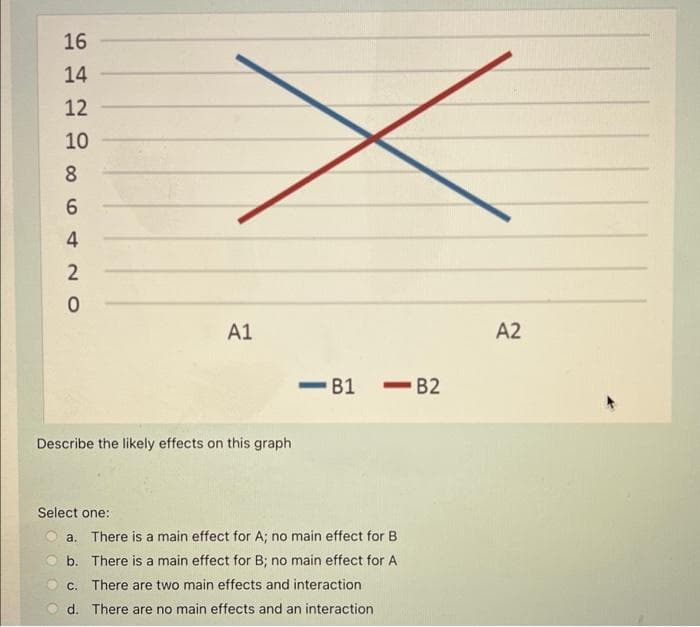
Q: The values in the following matrix are treatment means from a two-factor study. Wh B1 B2 A1 10 1 A2…
A:
Q: Calculate the mean and sample standard deviation of the data shown. Round to two decimal places. 2.6…
A:
Q: The Scenario: Congratulations. You have just inherited your uncle's business, which is a clothing…
A: Given Information: For Gender: Assign 1 as Female and 0 as Male. For Payment credit: Assign 1 as…
Q: Aprofessor wants to make sure that two different versions of a test are equivalert He decides to…
A: For the variance test, we take larger variance in numerator and smaller variance in denominator.…
Q: 1. A businessman needs 5 cabinets, 12 desks, and 18 shelves cleaned out. He has two part-time…
A:
Q: Historically, the average time it takes Jessica to swim the 200 meter butterfly is 148.4 seconds.…
A: Given: The sample mean X¯ = 147.8 The sample standard deviation s=2.3 The sample size n=50. To…
Q: tµ, be the mean diastolic blood pressure for women and let u, be the mean diastolic blood pressure…
A: The claim is that women and men have the same mean diastolic blood pressure.
Q: Part 1: OLS basics Consider the data in the table below. Y X 3 1 8. 3 2 1 7 1. In the space below…
A:
Q: 34 Activity A. Solve for the mean, median and mode of the following data set. 1) 54, 50, 54, 55, 56,…
A:
Q: 3. The time between arrivals of buses at a particular bus stop in a suburban area is exponentially…
A: Given that, the time betwee arrivals of buses at a particular bus stop in a suburban area is…
Q: Given that x = 36, n = 42, and o = 4, then we can be 95% confident that the true mean,u, lies…
A:
Q: Suppose you use simple random sampling to select and measure 50 turtles' weights, and find they have…
A:
Q: Look at the attached photo plz
A: we are given a residual plot for Pulse Rate versus Weight of 10 mammal species. And using the…
Q: In a two-way ANOVA in which one factor has 5 levels and the other has 3, what are the df for the…
A: Given : a = 5 b = 3
Q: Suppose that X follows a geometric distribution P(X = x) = p(1 - p)*-1 and assume a i.i.d. sample…
A: Since you have posted a question with multiple sub-parts, we will solve first two sub-parts for you.…
Q: 3.1 Solve the below problem (6) Let Y,, Y2, and Y, be random variables, where E (Y,) = 1, E (Y,) =…
A:
Q: a. What is the distribution of ? b. What is the distribution of X,+X;)² ? c. What is the…
A:
Q: What would you use to determine whether significant differences exist between all levels of your…
A: We have to choose correct option. Which is best to determine whether significant differences exist…
Q: here to view the table of critic here to view page 1 of the sta s here to view page 2 of the sta
A: Student Loan dataset 9100 400 9200 100 9500 9900 8400 5000 200 9800 5500…
Q: d) Given that R - 0.07, what is the value of R for this data set? Round to 3 decimal places e) You…
A: d) Given that R=0.07, The value of R^2 will be R*R= 0.07*0.07 = 0.0049 = 0.005
Q: A pollster wants to conduct a pre-election poll with a margin of error of 2.5% and a 95% confidence…
A: We have given that, Margin of error (E) = 2.5% = 0.025 and confidence level = 95% Then, We will…
Q: 2.1 Solve the below problem (show all calculations). Let Y, and Y, be random variables with joint…
A:
Q: marginal change and an ordered pair are given. b = 2, (5, 3) Write the equation of the line in…
A:
Q: The probability that a randomly chosen person tests negative
A: Here define events and use basic probability rule
Q: Question #6 If n = 23, x= 50, and s = 19, construct a confidence interval at a 95% confidence…
A: We have given that, Sample mean (x̄) = 50, sample standard deviation (s) = 19 and sample size (n) =…
Q: he expected value/mean, the variance, and the standard deviation of the following ete) probability…
A: Let X be the random variable having probability distribution is, X -1 0 2 P(X=x) 0.2 0.2 0.6…
Q: Suppose A is a set for which |A| = 12. How many 5-element subsets of A are %3D there? (the number of…
A: Here given A is set for which |A| = 12 So here no of elements in set A = 12
Q: Correlation Eunice Consultancy took a random sample of the monthly office rents per square meter…
A:
Q: The National Fire Incident Reporting Service stated that, among residential fires, 70% are in family…
A: Computing the probability: For the study, n= 6. P(family home) = 0.70 P(apartment)= 0.20 P(dwelling)…
Q: A particular fruit's weights are normally distributed, with a mean of 690 grams and a standard…
A:
Q: B, and the remainder on Machine C. 1) What is the probability of producing a defect at the…
A:
Q: Example 21.8) A marketing manager has to decide be- tween advertising his product on a national…
A:
Q: In a preelection poll, a pollster finds that 442 out of 650 people polled favor Smith. Construct the…
A: We need to construct the 95% confidence interval for the population proportion. We have given the…

Step by step
Solved in 2 steps

- Infants, even newborns, prefer to look at attractive faces compared to less attractive faces (Slater, et al., 1998). In the study, infants from 1 to 6 days old were shown two photographs of women’s faces. Previously, a group of adults had rated one of the faces as significantly more attractive than the other. The babies were positioned in front of a screen on which the photographs were presented. The pair of faces remained on the screen until the baby accumulated a total of 20 seconds of looking at one or the other. The number of seconds looking at the attractive face was recorded for each infant. Suppose that the study used a sample of n = 9 infants and the data produced an average of M = 13 for the attractive face with an estimated standard error sM= 1 (SS = 72). If there were no preference, the 20 seconds should be divided equally between the two photographs. Note that all the available information comes from the sample. Specifically, we do not know the population mean or the…Infants, even newborns, prefer to look at attractive faces compared to less attractive faces (Slater, et al., 1998). In the study, infants from 1 to 6 days old were shown two photographs of women’s faces. Previously, a group of adults had rated one of the faces as significantly more attractive than the other. The babies were positioned in front of a screen on which the photographs were presented. The pair of faces remained on the screen until the baby accumulated a total of 20 seconds of looking at one or the other. The number of seconds looking at the attractive face was recorded for each infant. Suppose that the study used a sample of n = 9 infants and the data produced an average of M = 13 for the attractive face with an estimated standard error sM= 1 (SS = 72). If there were no preference, the 20 seconds should be divided equally between the two photographs. Note that all the available information comes from the sample. Specifically, we do not know the population mean or the…Which of the following is true about interaction effects? a.They explain information that is additional to each individual fixed effect. b.They occur when a confounding factor contaminates an experimental factor. c.All of these are true d.They are additive effects between two or more independent variables e.They are additive effects between two or more independent variables, and they explain information that is additional to each individual effect
- The sales manager of a company has budgeted K120, 000 for an advertising programme for one of the firm’s product. The selected advertising programme consists of running advertisements in two different magazines. The advertisement for magazine 1 costs K2000 per run while the advertisement for magazine 2 costs K.5000 per run. Past experience has indicated that at least 20 runs in magazine 1, and at least 10 runs in magazine 2 are necessary to penetrate the market with any appreciable effect. Also, experience has indicated that there is no reason to make more than 50 runs in either of the two magazines. How many runs in magazine 1 and how many in magazine 2 should be made? Use simplex method.Marine biologists have noticed that the color of the outermost growth band on a clam tends to be related to the time of year in which the clam dies. A biologist conducted a small investigation of whether this is true for the species Protothaca staminea. She collected a sample of 50 clam shells in February and 27 clam shells in March. 15 of the shells from February had a dark color on the outermost growth band, whereas 8 of the shells from March had a dark color on the outermost growth band. Carry out a hypothesis test to see if there is a difference in the proportion of shells with a dark outermost growth band between the two months. The point estimate for the true difference in proportion of dark growth bands between February and March is:Marine biologists have noticed that the color of the outermost growth band on a clam tends to be related to the time of year in which the clam dies. A biologist conducted a small investigation of whether this is true for the species Protothaca staminea. She collected a sample of 50 clam shells in February and 27 clam shells in March. 15 of the shells from February had a dark color on the outermost growth band, whereas 8 of the shells from March had a dark color on the outermost growth band. Carry out a hypothesis test to see if there is a difference in the proportion of shells with a dark outermost growth band between the two months. Let ? = 0.01. A) The point estimate for the true difference in proportion of dark growth bands between February and March is:
- Marine biologists have noticed that the color of the outermost growth band on a clam tends to be related to the time of year in which the clam dies. A biologist conducted a small investigation of whether this is true for the species Protothaca staminea. She collected a sample of 50 clam shells in February and 27 clam shells in March. 15 of the shells from February had a dark color on the outermost growth band, whereas 8 of the shells from March had a dark color on the outermost growth band. Carry out a hypothesis test to see if there is a difference in the proportion of shells with a dark outermost growth band between the two months. Let ? = 0.01.Note: Do all calculations as February - March A) The point estimate for the true difference in proportion of dark growth bands between February and March is: I need help and webassign rejected the 0.0037 as the answer. I'm so lost. I emailed my professor and he hasn't gotten back to me. Please help. Thank you.An auctioneer of antique Iranian rugs kept records of his weekly auctions in order to determine the relationships among price, age of carpet or rug, number of people attending the auction, and the number of times the winning bidder had previously attended his auctions. He felt that, with this information, he could plan his auctions better, serve his steady customers better, and make a higher overall profit for himself. The results shown in the accompanying table were obtained.Consider the following variables: Y=daily productivity score (measured in points) X1=0 if undergraduate student,1 if graduate student X2=hours of sleep per night 1. If you want to test whether type of student modifies the association between hours of sleep per night and daily productivity score, which model (from attached image) should you consider and what is the null hypothesis for this test? A. Use Model 3 and test H0: β2=0 B. Use Model 5 and test H0: β3=0 C. Use Model 5 and test H0: β1=0 D. Use Model 5 and test H0: β2=0 E. Use Model 2 and test H0: β1=0 2. Suppose that you decide to use Model 5 (from pocture attached) to describe the relationship between type of student, hours of sleep per night, and daily productivity score. You use the method of least squares to obtain the following: Y= -0.5 + 3(X1) + 1.5(X2) + 2.5(X1X2) What is the estimated slope relating hours of sleep per night and daily productivity score among undergraduate students? A. 2 B. None of…
- Marine biologists have noticed that the color of the outermost growth band on a clam tends to be related to the time of year in which the clam dies. A biologist conducted a small investigation of whether this is true for the species Protothaca staminea. She collected a sample of 55 clam shells in February and 55 clam shells in March. 14 of the shells from February had a dark color on the outermost growth band, whereas 8 of the shells from March had a dark color on the outermost growth band. Carry out a hypothesis test to see if there is a difference in the proportion of shells with a dark outermost growth band between the two months; specifically, if the population proportion in February is higher than March. Let ? = 0.1.Note: Do all calculations as February - MarchA) The point estimate for the true difference in proportion of dark growth bands between February and March is: Note: answer using 4 decimal precisionB) The test statistic, ztest, is: Note: answer using 2 decimal…A positive value of the correlation coefficient "r" means_________ Group of answer choices that when x increases, y tends to increase and when x decreases, y tends to decrease that when x increases, y tends to increase and when x increases, y tends to decrease that when x increases, y tends to decrease and when x decreases, y tends to increase1. Move the slider so that the correlation coefficient is r = -0.9. At an x-axis value of 40, which of the following is the approximate range (lowest to highest) of the y-values?2. Now move the slider so that the correlation coefficient is r = 0.15. At an x-axis value of 40, which of the following is the approximate range (lowest to highest) of the y-values?


