Assessment 1. Consider the scores of 30 students in an English class. 88 73 62 53 74 84 78 81 86 81 85 78 72 73 76 63 68 82 85 72 74 73 62 65 60 88 71 85 84 57 a. Using the data above, construct the following graphs: stem plots line graphs histograms box-plots b. Using also the data above, determine the first and third quartiles. Write a brief interpretation of the results. c. Determine also the 75th, 50th, and 24th percentiles. Interpret the results.
Assessment 1. Consider the scores of 30 students in an English class. 88 73 62 53 74 84 78 81 86 81 85 78 72 73 76 63 68 82 85 72 74 73 62 65 60 88 71 85 84 57 a. Using the data above, construct the following graphs: stem plots line graphs histograms box-plots b. Using also the data above, determine the first and third quartiles. Write a brief interpretation of the results. c. Determine also the 75th, 50th, and 24th percentiles. Interpret the results.

Glencoe Algebra 1, Student Edition, 9780079039897, 0079039898, 2018
18th Edition
ISBN:9780079039897
Author:Carter
Publisher:Carter
Chapter10: Statistics
Section10.3: Measures Of Spread
Problem 1GP

Related questions
Question
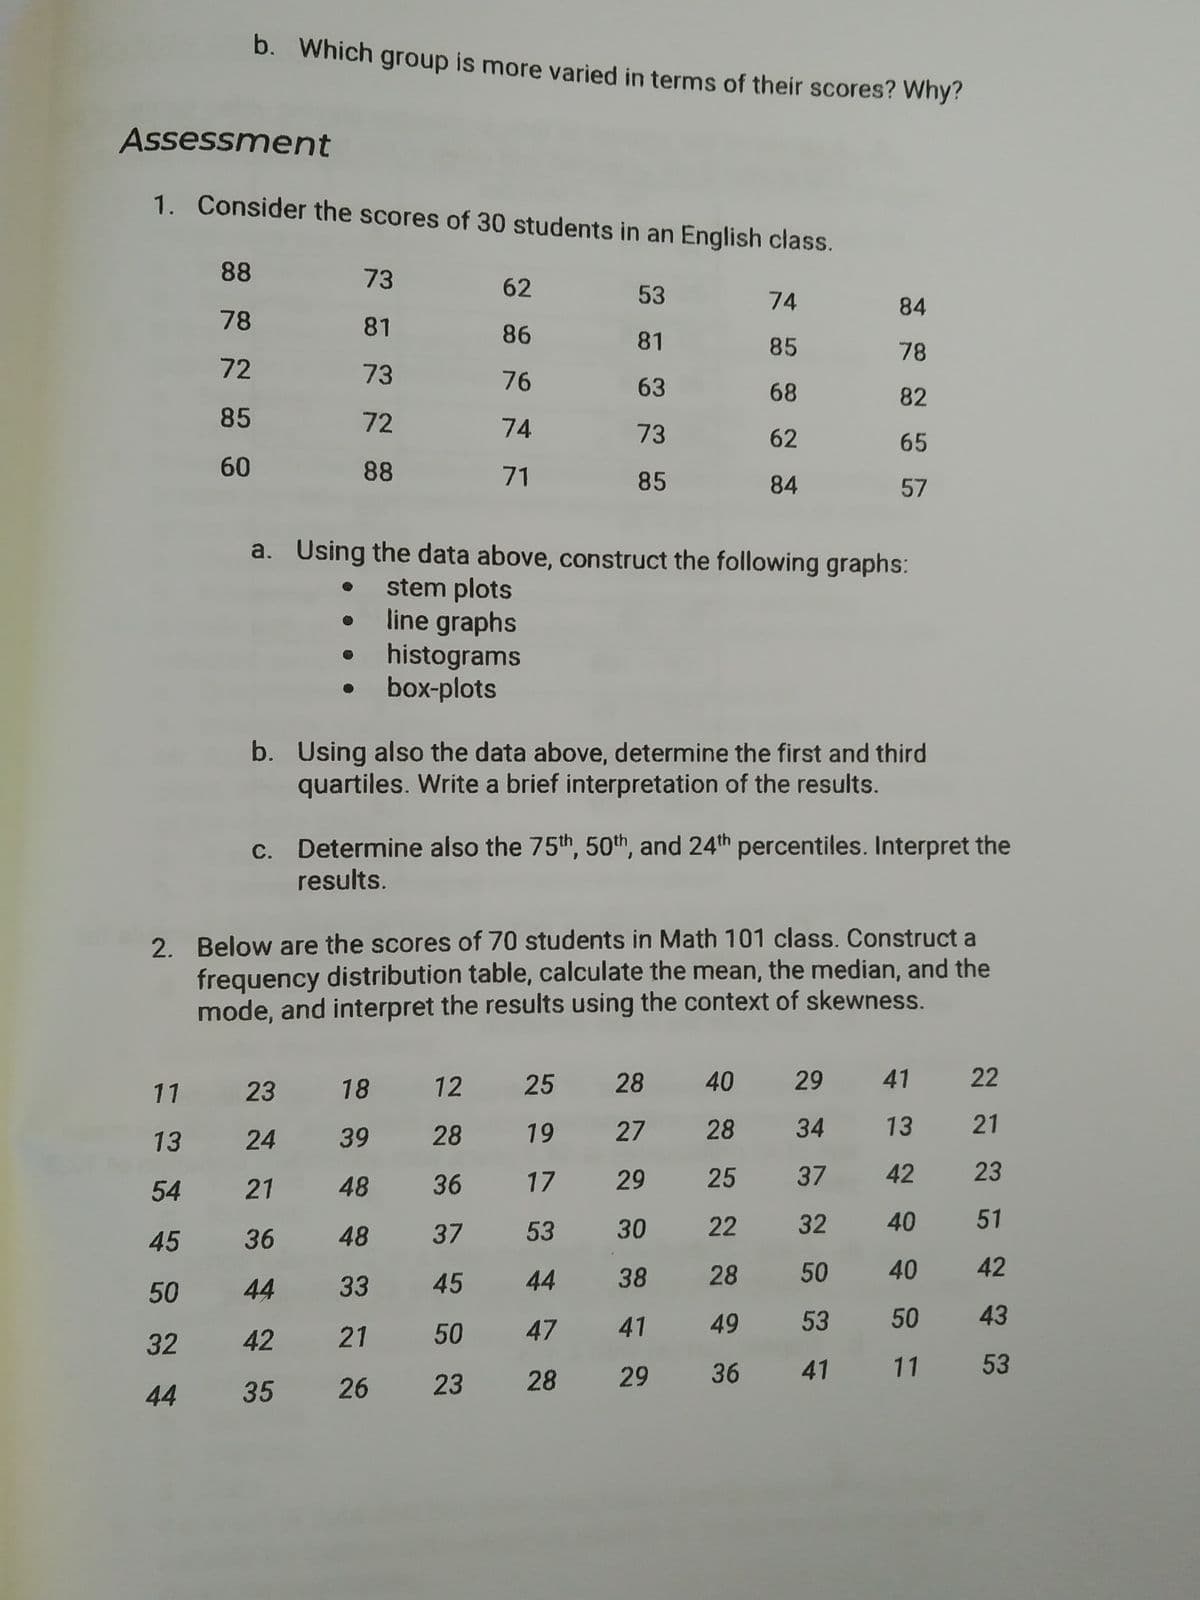
Transcribed Image Text:b. Which group is more varied in terms of their scores? Why?
Assessment
1. Consider the scores of 30 students in an English class.
88
73
62
53
74
84
78
81
86
81
85
78
72
73
76
63
68
82
85
72
74
73
62
65
60
88
71
85
84
57
a. Using the data above, construct the following graphs:
stem plots
line graphs
histograms
box-plots
b. Using also the data above, determine the first and third
quartiles. Write a brief interpretation of the results.
c. Determine also the 75th, 50th, and 24th percentiles. Interpret the
results.
2. Below are the scores of 70 students in Math 101 class. Construct a
frequency distribution table, calculate the mean, the median, and the
mode, and interpret the results using the context of skewness.
12 25 28
40 29
41
22
11 23 18
19 27 28 34
13 21
13 24 39 28
48
36 17
29
25 37
42
23
54 21
53
30 22
32 40
51
45 36
48 37
33
45
44
38 28
50 40
42
50
44
49 53 50
43
32
42 21 50
47 41
28 29 36 41 11 53
44
35 26 23
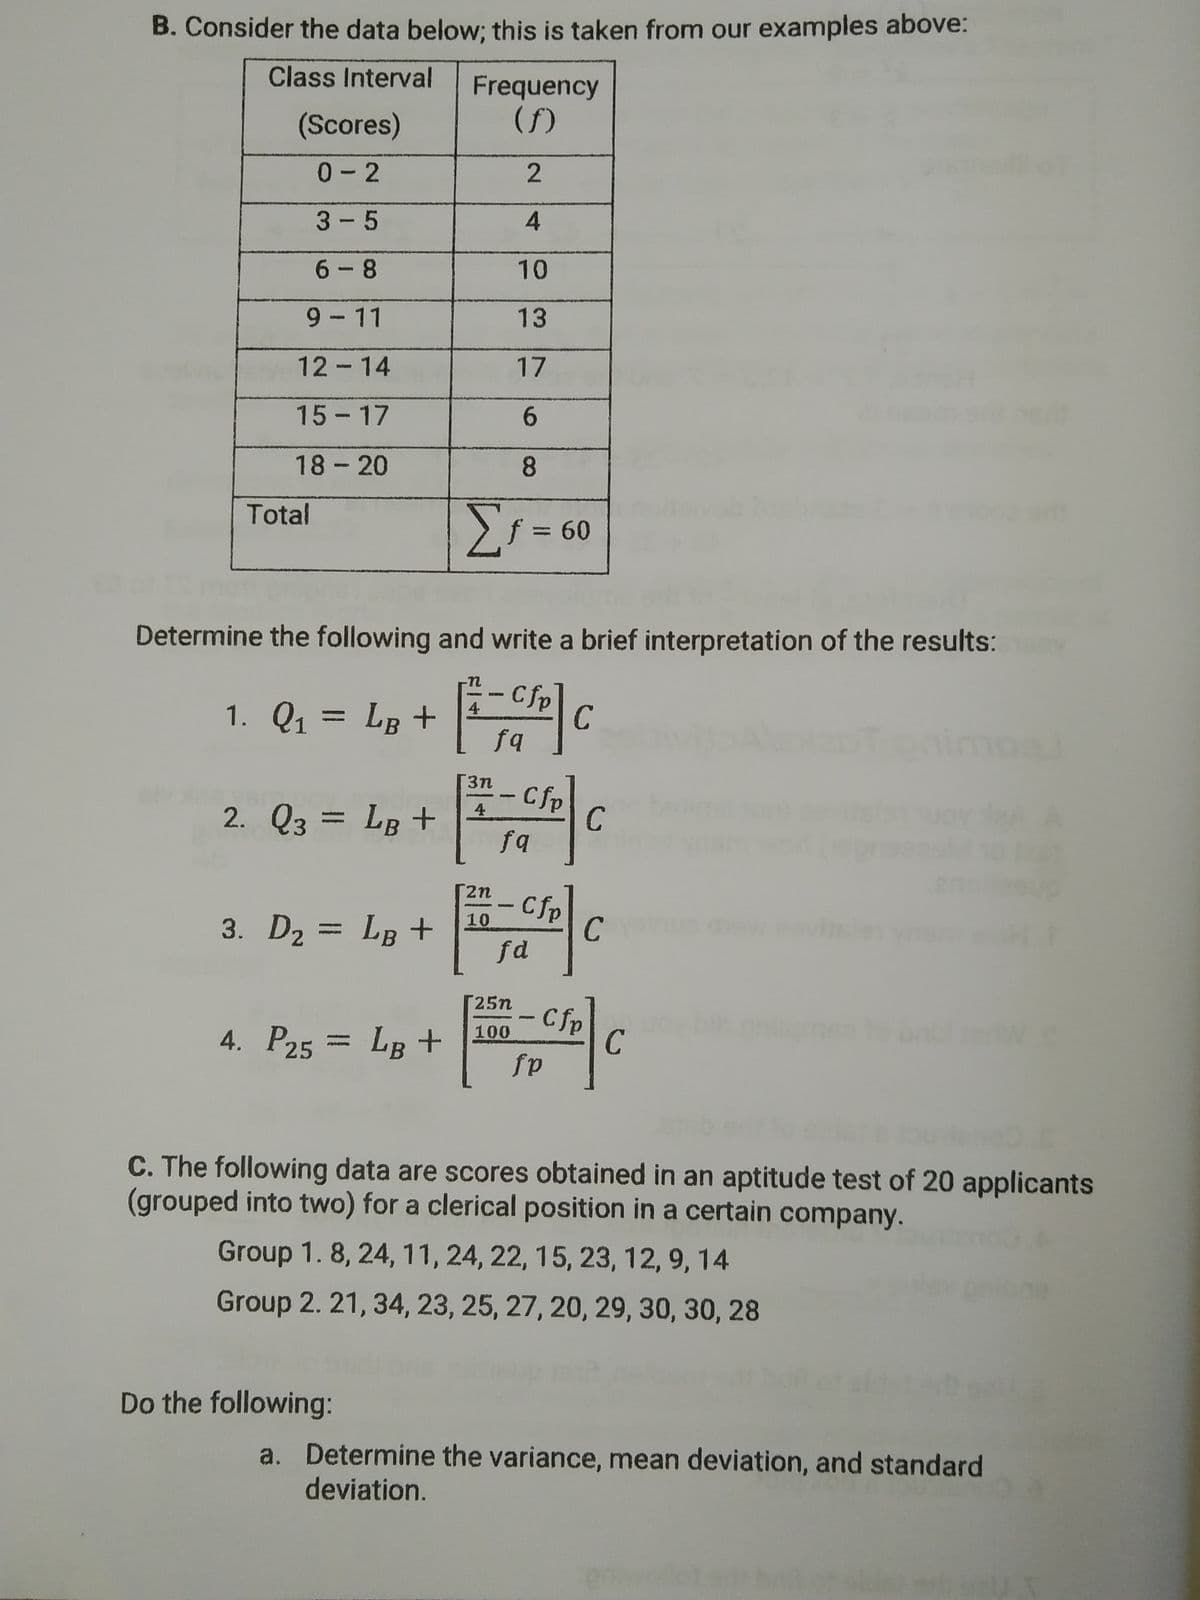
Transcribed Image Text:B. Consider the data below; this is taken from our examples above:
Class Interval
Frequency
(f)
(Scores)
0- 2
3 - 5
6 - 8
10
9 - 11
13
12 - 14
17
15 - 17
18 - 20
8
Total
f = 60
%3D
Determine the following and write a brief interpretation of the results:
- Cfp
C
fa
1. Q1 = LB +
4
%3D
3n
2. Q3 = LB +
Cfp
C
4
fq
2n
Cfp
|10
C
fd
3. D2 = LB +
25n
4. P25 = LB+
Cfp
C
100
fp
C. The following data are scores obtained in an aptitude test of 20 applicants
(grouped into two) for a clerical position in a certain company.
Group 1. 8, 24, 11, 24, 22, 15, 23, 12, 9, 14
Group 2. 21, 34, 23, 25, 27, 20, 29, 30, 30, 28
Do the following:
a. Determine the variance, mean deviation, and standard
deviation.
2.
Expert Solution
This question has been solved!
Explore an expertly crafted, step-by-step solution for a thorough understanding of key concepts.

This is a popular solution!

Trending now
This is a popular solution!

Step by step
Solved in 4 steps with 3 images

Recommended textbooks for you
Glencoe Algebra 1, Student Edition, 9780079039897…
Algebra
ISBN:
9780079039897
Author:
Carter
Publisher:
McGraw Hill
Glencoe Algebra 1, Student Edition, 9780079039897…
Algebra
ISBN:
9780079039897
Author:
Carter
Publisher:
McGraw Hill