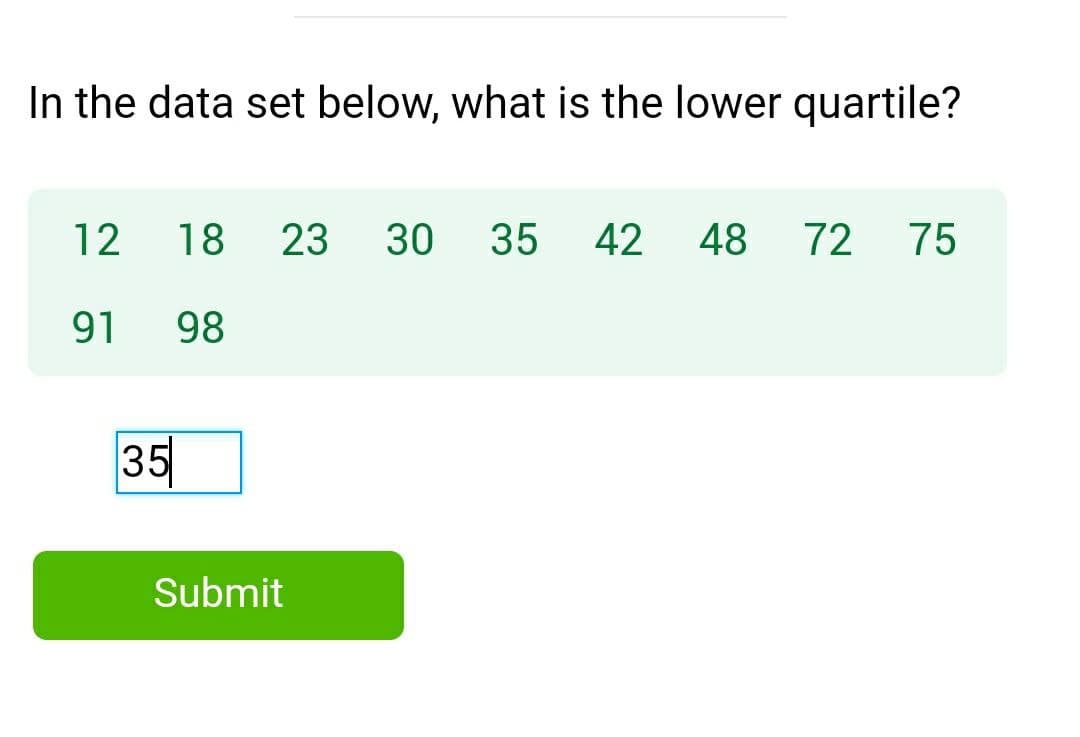
In the data set below, what is the lower quartile? 12 18 23 30 35 42 48 72 75 91 98


Q: Find the upper quartile of the data shown on the box-and-whisker plot below. 10 20 30 40 50 60 70 80…
A:
Q: What is the third quartile of the given data set? {-26, -15, -7, 0, 1, 6, 9, 15, 22, 22, 26, 28} О…
A: We have given that, -26, -15, -7, 0, 1, 6, 9, 15, 22, 22, 26, 28 Then, We will find third quartile?…
Q: B- For data mentioned below, find mean, median, variance, Range, standare deviation, First, second…
A: Data, in ascending order,1,2,3,5,7,8,9,11,13,14,15,16,17,18,19,20,21,22,24,25,26n=0
Q: Find the indicated percentile, decile, or quartile. The test scores of 32 students are listed…
A:
Q: Find the first and third quartile for the data shown 13.5 13.6 14.3 14.5 15.1 22.5 23.1 28.6 29.6 30…
A:
Q: What percent of the observations in a distribution are greater than the first quartile? O 33% 50%…
A: In statistics, a Quartile is a type of quantile which divides the number of data points into four…
Q: Find the 5 number summary for the data shown 4 6 18 28 45 48 61 68 75 76 87 88 89 90 91 5 number…
A: To find the 5 number summary of a data set, you need to find the smallest data value (minimum), the…
Q: The numbers represent the scores (in points) for a sample of 10 basketball games: 45…
A: Sample number of games n = 10 We have to calculate the percentile corresponding to 53 points scored.
Q: The commute times (in minutes) of 30 employees are listed below 31 41 45 48 52 55 56 55 63 65 67 67…
A: The given data is as follows: 31 41 45 48 52 55 56 55 63 65 67 67 69…
Q: Class: Paula recorded the times of 10 different students who ran the 200 yard dash 10 12 14 16 18 20…
A: In this question we have to find out the mean of the data which we can find out by adding the data…
Q: Find the first quartile for this list of numbers 12 81 98 10 55 83 85 34 31 8 53 74 76 58 Quartile 1…
A: Given data is12,98,10,83,34,8,74,58,81,5,55,85,31,53,76Arrange the given data in ascending order5 ,…
Q: In the data set below, what are the lower quartile, the median, and the upper quartile? 1 2 3 3 3 5…
A:
Q: What is the interquartile range of the following data set? 46, 27, 48, 96, 61, 84, 29, 1, 64, 5, 34…
A:
Q: 1) In the data set below, what are the lower quartile, the median, and the upper quartile? 48 48 58…
A: Th given data is: 48, 48, 58, 74, 80, 84, 93 There are 7 values. So the median is the (7+1)/2= 4th…
Q: Calculate the quartiles from the following data : Weekly wages in Dollars : No. of wage earners…
A:
Q: What is the third quartile for the data set? 45 6 7 O 2 O 1.5 O 6 O 7.5
A: Consider the data set
Q: What percent of the data fall below the 1st quartile? 1. 0% 2. 25% 3. 50% 4. 75% 5. 100%
A: The first quartile is denoted by Q1 and this is the median of lower half of the data set.
Q: B- For data mentioned below, find mean, median, variance, Range, standar deviation, First, second…
A:
Q: Find the first quartile for the given quantitative data. 29 20 62 63 38 40 25 24 35 46 14 17 53 79…
A: From the provided information, Number of observations (n) = 15
Q: In Exercises, we have provided simple data sets for you to practice the basics of finding a…
A: The data is 2, 5, 0, –1. The population size is 4.
Q: Find the lower and upper quartiles, 8h decile, 45th percentile, and the coefficient of skewness for…
A: Solution-: We have following table: Class Freq (fi) 30-50 15 50-70 12 70-90 19 90-110 14…
Q: Consider the sorted data set below: 34 50 68 75 89 91 97 What is the median?
A:
Q: From the data diven below, what value corresponds to the 40th percentile? 804 736 659 489…
A: Given : n=9 Data 804 736 659 489 777 623 597 524 228
Q: In the data set below, what is the lower quartile? 32 39 50 64 66 90 99 Submit
A:
Q: By hand, find the first quartile of the following set of numbers: 21 24 Answer: 25 26 27 28 29 31 32…
A: Arrange the data set in ascending order are. 21,24,25,26,27,28,29,31,32,35 n=10
Q: 15. The 3rd decile is REFER TO THE SET OF DATA BELOW: Score Frequency Cumulative Frequency 26 30 18…
A:
Q: Find the 5 number summary for the data shown 9. 18 20 35 44 47 48 64 65 97 5 number summary: Use the…
A:
Q: In the data set below, what is the lower quartile? 32 41 43 44 55 65 75 82 84 84 Submit
A:
Q: The test scores of 15 students are listed below. Find the 25th percentile of students' test scores.…
A: Given information- We have given the test score of 15 students listed below. 40, 45, 50, 56, 58, 63,…
Q: The number of traffic violations recorded by a police department for 10 days is shown. Find the…
A:
Q: Consider the data set 6. 9. 7. 2. 3 9. 2 Find the average (mean): Find the median:
A: Given that, Data set: 6,1,9,7,2,3,9,2,2,2
Q: What is the value of the third decile in the following set of data? 27, 21, 22, 23, 15, 19, 20, 24,…
A: Since you have posted multiple questions and we can answer one question. So, answered the first…
Q: 2, 5, 6, 8, 10, 11, 13, 15, 17: Mid Quartile of the data 10.50 9.25 10.25 9.75
A: Arranging Observations in the ascending order, We get :2,5,6,8,10,11,13,15,17Here, n=9 Q1=(n+1)/4)th…
Q: Use the dataset below to calculate the median. Report your answer with one decimal place. 2 18 13 20…
A:
Q: The number of incidents in which police were needed for a sample of 11 schools in one county is: 18…
A: Use EXCEL Procedure to obtain the value of first quartile. Follow the instruction to obtain the…
Q: In Exercises, we have provided simple data sets for you to practice the basics of finding a…
A: The data is 1, 9, 8, 4, 3. The population size is 5.
Q: 3. What is the value that corresponds to the 60th percentile in the following data set? Use linear…
A: The question is about measures Given Data :
Q: In Exercises, we have provided simple data sets for you to practice the basics of finding a…
A: The data is 1, 2, 4, 4. The population size is 4.
Q: Data Points frequency 1.2 4.8 8 8.4 30 12.0 15.6 3
A:
Q: PLEASE SHOW WORKING Based on the data set below, what is the standard deviation? 28…
A: we hope the last data value is 4 only (not a double digit value?)
Q: (c) Find the third quartile of the above data. 87 88.5 057 58.5
A:
Q: Calculate the 40th percentile of the data set shown 3.3 8.1 16.5 23.4 25.6 26.6 27.6 28.5 29.8 5.
A: Arrange the data in an ascending order. 3.3,5,8.1,16.5,23.4,25.6,26.6,27.6,28.5,29.8 Here, sample…
Q: Refer to the data below. 38 42 26 22 30 42 36 42 1)The mean is 2)The range is: 3)The difference…
A:
Q: Find the percentile for the data value. Data set: 4 13 8 6 4 4 13 6 4 13 2 13 15 5 9 4 12 8 6 1 Data…
A: Given data, 4,13,8,6,4,4,13,6,4,13,2,13,15,5,9,4,12,8,6,13 What is percentile for data value 6?
Q: Forty students took a 50 point computer science test. The scores are shown in the stem and leaf…
A: From the given information we find the 3rd quartile.
Q: In the data set below, the frequency of is 5, 7, 1, 12, 17, 5, 1, 7, 10, 5 5 12 15 1 3 10 9.
A: Find the frequency of the following data 5, 7, 1, 12, 17, 5, 1, 7, 10, 5
Q: For the data listed below, find the following. 72, 70, 95, 91, 99, 95, 93, 80, 84 (a) the mean (b)…
A: First arrange the given data in ascending order. 70,72,80,84,91,93,95,95,99
Q: Approximately, what percent of the data is less than the third quartile? O 75% O 0% 50% 25%
A:
Q: The data below represents the lower blood pressure for people in our class. 88 76 96 114 65 84 86 91…
A:


Trending now
This is a popular solution!

Step by step
Solved in 3 steps
