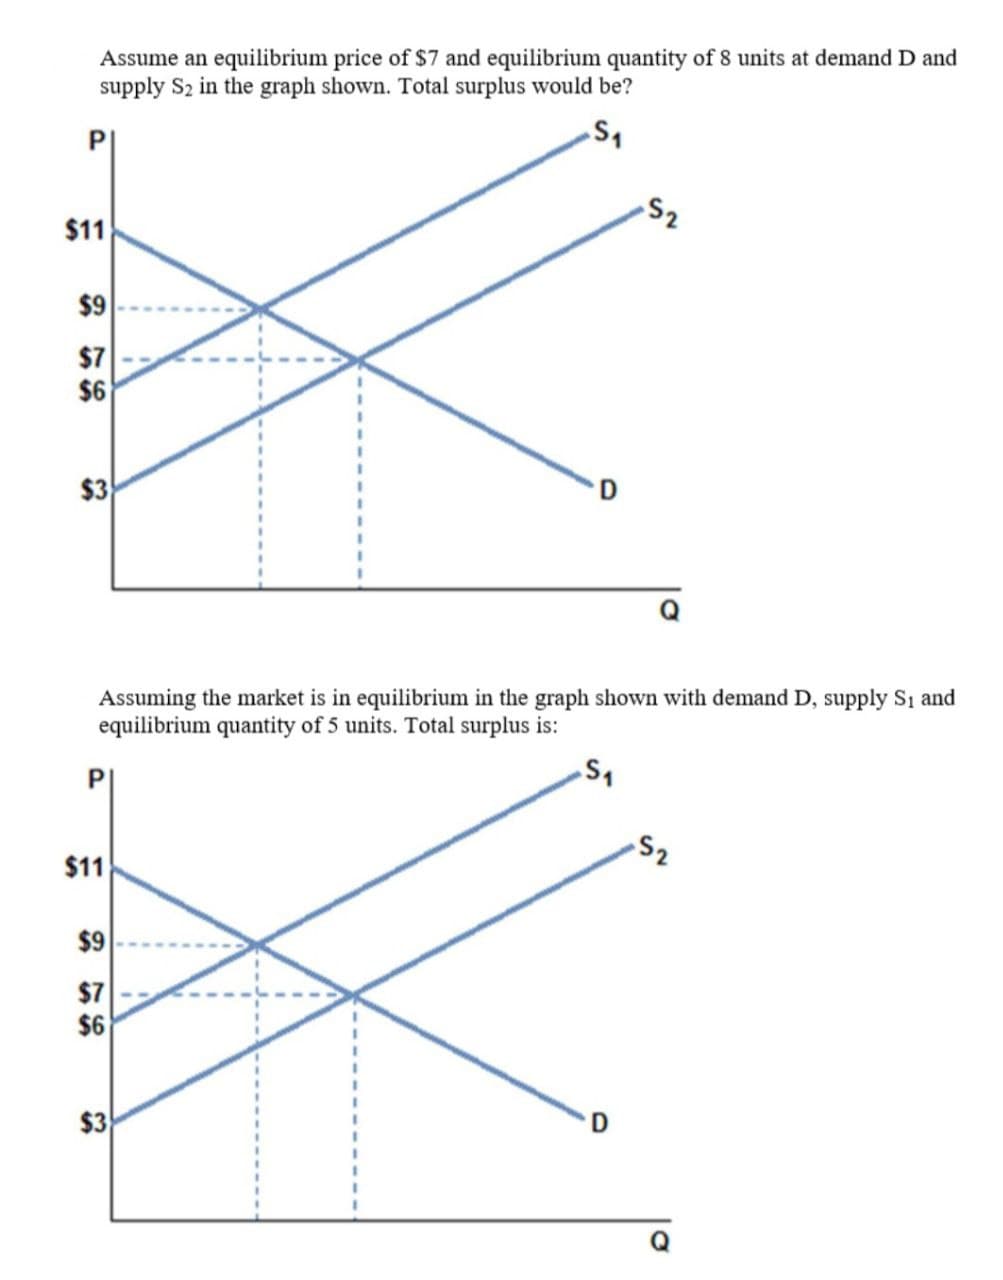
Assume an equilibrium price of $7 and equilibrium quantity of 8 units at demand D and supply S2 in the graph shown. Total surplus would be? PI S2 11


Q: quilibrium price of gasoline.
A: The ‘law of supply’ states, ceteris paribus (keeping other things constant) when the price(P) of a…
Q: If the supply equation is P = (Q + 4)2 . find the consumer’s surplus when the consumer purchases 40…
A: Consumer surplus is the difference between what the consumer wants to pay and what the consumer…
Q: As you now know, we are considering entering the tomato sauce market. We have continued our research…
A: The equilibrium price and equilibrium quantity of a good sold in the market are determined by the…
Q: The demand curve for guitars is given by Pd = 150 - 5Qd and supply for guitars is given by Ps = 6 +…
A: Demand function Pd = 150 - 5Qd and supply function Ps = 6 +Qs
Q: Suppose the demand for football tickets at a local college is Q=70,000-500P and the supply of…
A: Equilibrium is measured at the point where demand in the market comes equal to the supply in the…
Q: Calculate the Consumer surplus for 28 liras in a market with the demand function, p = - (q + 2) 2 +…
A: The difference between the price that customers pay and a particular price that they are willing to…
Q: Referring to the following data, answer the following questions. The pencil market is characterized…
A:
Q: C. Suppose that for Q units of a certain product, the demand function is P = 200e010 cedis and the…
A: Given information Demand function P=200e-0.01Q Supply function P=(200Q+49)0.5
Q: a diagram showing equilibrium of demand and supply, Excess supply is found ____________. a. above…
A: Equilibrium is determined at the point where the quantity demanded and the quantity supplied are…
Q: Figure 7-4 Price F B P1 P2 Demand Q1 Q2 Quantity Refer to Figure 74. Which area represents the…
A: The law of demand states that there is an inverse relationship between the price and quantity…
Q: Present your solutions neatly and orderly. 1) Assume that the inverse demand and supply function for…
A: Inverse demand function = P = 6000 / (q+50) Supply function: P = q + 10 Equilibrium where demand =…
Q: uppose the demand for shoes is given by: QD= 210 -2P. The supply of shoes is given by: QS= 9P -120.…
A: Competitive equilibrium is a condition in which profit-maximizing producers…
Q: A baker will supply 19 jumbo cinnamon rolls to a cafe at a price of $457 each. If she is offered…
A: please find the answer below.
Q: How do you derive the floor price that leads to a market surplus of 5 if the current market is…
A: Price floor refers to the situation where the price is charged more than the Equilibrium price that…
Q: a b d D Quantity Price
A: Equilibrium is achieved at a point where demand curve intersects supply curve.
Q: Calculate the producers' surplus (in dollars) for the supply equation at the indicated unit price p.…
A: Given: Supply function
Q: Find the consumers surplus at a price level of $6 for the price-demand equation p= D(x) = 20 - 0.05x
A: Consumer surplus is the area between the demand curve and the price line. Given the price is $6,…
Q: For the demand and supply equations: S(q) = 5 + 0.004q2 , D(q) = 25 − .004x2 a)find the…
A: Demand curve represents the negative relation between the price and the quantity demanded. Whereas,…
Q: Joe's demand for spring water can be represented as Q 10-P He recently discovered a spring where…
A: Here, demand graph is given as: D=10-P And, price is given as $10.
Q: Suppose the market demand curve for cranberry is given by the equation Qd=500-4P, while market…
A: At equilibrium price Demand = Supply
Q: Suppose cauliflower and broccoli are substitutes in consumption. Suppose further that the supply of…
A: Consumer surplus is defined as the difference between the ability to pay of consumer and the amount…
Q: If the supply and demand functions are given by p=20e0.4Q and p=100e-0.2Q, respectively, find the…
A: Answer: Given, Supply function: p=20e0.4Q Supply function: p=100e-0.2Q Note: the values will be in…
Q: Consider the supply and demand functions graphed below. Suppose a tax is imposed such that the after…
A: Tax would shift the supply curve leftward such as new equilibrium quantity is 50 units. At 50 units,…
Q: Imagine the market for Good X has a demand function of QDX = 40 – PX and a supply function of QSX =…
A: Consumer surplus is the difference between the maximum price a consumer is willing to pay and the…
Q: If the supply curve is q = 4 + 2p, what is the producer surplus if the price is p = 12? Producer…
A: Producer surplus is the difference between market price and minimum price producers are willing to…
Q: Calculate the consumers' surplus at the indicated unit price p for the demand equation. HINT [See…
A: Consumer surplus refer to the area under the demand curve which is the difference between what a…
Q: The demand curve for product X is given by Qxd = 300 − 2Px. a. Find the…
A: Demand function depicts quantity demanded as a function of prices whereas inverse demand function…
Q: C. Suppose that for Q units of a certain product, the demand function is P = 200e0010 cedis and the…
A: Given information Demand function P=200e-0.01Q Supply function P=(200Q+49)0.5
Q: In this problem, p is in dollars and x is the number of units. The demand function for a certain…
A: Given: Demand function P = 144 - x2 Supply function P = x2 + 2x + 104 To find out equilibrium point,…
Q: The demand function for a good is given by Q = 40 - 5P+4Y, where P is price and Y is income. The…
A: "In general, demand function reflects an inverse relationship between price and quantity demanded of…
Q: Suppose a supply curve(in dollars per unit) is S(q)= 20+7e0.014 . Find the price at which 7 units…
A: P = 20 + 7e0.01q q = 7 units
Q: Consider the following demand and supply functions. D(x) = 83-0.4x, S(x) = 2x + 75.8,0 ≤ x ≤ 90 Step…
A: The consumer surplus alludes to the contrast between the thing a consumer will pay and what they…
Q: If total surplus rises, there may have been a(n). in demand or a(n), in supply. decrease; increase…
A: Producer surplus is defined because the difference between the number the producer is willing to…
Q: In Laramie in early winter the inverse demand function for snow shovels is: p=200-4q and the market…
A: Given demand function = P = 200 – 4q Market price = 40 $ When price is 40 $ quantity demanded is 40…
Q: ) If the price of good X increases from RM3 to RM5, the quantity demanded drops from 10 to 12. Find…
A: Slope of the demand curve can be calculated by using the following formula.
Q: An economist estimates that a market has a demand curve of the form P = 37-(1.23) Q and a supply…
A: Economic market equilibrium happens when the degrees of supply and demand adjust, making ideal…
Q: Suppose market demand and supply are given by Qd = 100 − 2P and Qs = 5 + 3P. The equilibrium…
A: The market demand curve indicates the total quantity demanded in the market at each price. The…
Q: The supply curve for product X is given by Qxs = −520 + 20 Px . a. Find the inverse supply curve. b.…
A: a. The inverse supply function of a given supply curve for the product X is can be represents as…
Q: Calculate the producers' surplus (in dollars) for the supply equation at the indicated unit price p.…
A: Producer surplus(PS) refers to the difference between how much a seller(s) is willing to accept for…
Q: The supply curve for product X is given by QXS = -400 + 10PX .a. Find the inverse supply curve.P =…
A: QXS =…
Q: Find the consumers' surplus at a price level of $1 for the price-demand equation p=D(x)=20−0.1x…
A: Here, demand function is given as, p=D(x)=20−0.1x To find: consumer surplus at the price of $1.
Q: Consider a market where demand and supply satisfy the following equationse QD = 12 – 2 P,4 Qs = 2P.-…
A: We have the following information-QD = 12-2PQs = 2P(a) Find the current equilibrium price and…
Q: if the price fall from p0 to p1, the change in consumer surplus is equal to what area?
A: Consumer surplus is the difference between the maximum willingness to pay for the good and actually…
Q: Calculate the equilibrium P.
A: At equilibrium point quantity demand and quantity supply will be equal.
Q: Suppose market demand is given by the equation Q° = 40 – 2P Refer to Scenario. If the market…
A: The equilibrium price and quantity of a good sold in the market are determined by the forces of…
Q: Suppose the supply function for X good is expressed as Q X = - 20 + 4P x . If the price of X good…
A: Here, supply function is given as: QX=-20+4Px To find: producer surplus when price changed from 8…
Q: In a given market, there are three demanders of a good with Qd¹+P=12, P=10-2Qd² and Qd³=10-P as…
A: Answer: Given, Individual Demand functions:…


Trending now
This is a popular solution!

Step by step
Solved in 2 steps


- Suppose the market demand for sanitizer is given by Qd = 300 – 10P and the market supply for sanitizer is given by and Qs = 40P -200 where P= price (per sanitizer). a. Tabulate and graph the supply and demand schedules for sanitizer using GHC 5 through GHC 30 as the value of P.b. In equilibrium, how many sanitizers would be sold and atwhat price?c. What would happen if the price of sanitizer is set at GHC 20 or GHC 5?Explain the market adjustment process in both cases.Given the following demand and supply equations: Demand Qd = 100 - 2P Supply QS = 10 + P 1. Mathematically compute for the equilibrium price and quantity. Why would such a combination be the market equilibrium? 2. Will a shortage or surplus exist in the market if the price is i.) 20 per unit and ii.) 35 per unit? Compute mathematically how large is the shortage/surplus. 3. Illustrate in a completely labelled graph the situations presented in (2.) above.I. For the normal good, make a (Hypothetical) linear demand schedule with 7 different price points and corresponding quantity demanded for your own household. For the same normal good, make another (Hypothetical) linear demand schedule with 7 different price points and corresponding quantity demanded for your neighbor. Assuming that you and your neighbor are the only two households in the market, make a market demand schedule for the same normal good. Draw and interpret a graph to show the market demand and impact of changes in quantity demanded, if price of the same normal good decreases.
- The demand and supply functions for three (03) goods are given as follows: Dx = 100-3Px+Py+3Pz Dy = 80+Px-2Py-Pz Dz = 120+3Px-Py-4Pz Sx = -10+Px Sy = -20+3Py Sz = -30+2Pz The equilibrium prices and quantities of all three goods are: Px= 78.72 Qx= 68.72 Py= 23.66 Qy= 50.98 Pz= 60.42 Qz= 90.84 The government decides to: a) impose a 25% Tax on X b) impose a 5 Rs/unit Tax on Y c) give a 10% subsidy on good z When policies (a,b), (b,c), and (a,b,c) are jointly implemented. Analyze the impact on equilibrium prices and quantities. Which policy choice is best? Why?The demand and supply functions for three (03) goods are given as follows: Dx = 100-3Px+Py+3Pz Dy = 80+Px-2Py-Pz Dz = 120+3Px-Py-4Pz Sx = -10+Px Sy = -20+3Py Sz = -30+2Pz The equilibrium prices and quantities of all three goods are: Px= 78.72 Qx= 68.72 Py= 23.66 Qy= 50.98 Pz= 60.42 Qz= 90.84 The government decides to: Give a 10% subsidy on good Z. Analyse the impact on equilibrium prices and quantities.The demand and supply functions for three (03) goods are given as follows: Dx = 100-3Px+Py+3Pz Dy = 80+Px-2Py-Pz Dz = 120+3Px-Py-4Pz Sx = -10+Px Sy = -20+3Py Sz = -30+2Pz The equilibrium prices and quantities of all three goods are: Px= 78.72 Qx= 68.72 Py= 23.66 Qy= 50.98 Pz= 60.42 Qz= 90.84 The government decides to: impose a 25% Tax on X impose a 5 Rs/unit Tax on Y When these above policies are jointly implemented. Analyse the impact on equilibrium prices and quantities.
- The demand and supply functions for three (03) goods are given as follows: Dx = 100-3Px+Py+3Pz Dy = 80+Px-2Py-Pz Dz = 120+3Px-Py-4Pz Sx = -10+Px Sy = -20+3Py Sz = -30+2Pz The equilibrium prices and quantities of all three goods are: Px= 78.72 Qx= 68.72 Py= 23.66 Qy= 50.98 Pz= 60.42 Qz= 90.84 The government decides to: impose a 25% Tax on X impose a 5 Rs/unit Tax on Y give a 10% subsidy on good Z. When the above policies are jointly implemented. Analyse the impact on equilibrium prices and quantities.The demand and supply functions for three (03) goods are given as follows: Dx = 100-3Px+Py+3Pz Dy = 80+Px-2Py-Pz Dz = 120+3Px-Py-4Pz Sx = -10+Px Sy = -20+3Py Sz = -30+2Pz The equilibrium prices and quantities of all three goods are: Px= 78.72 Qx= 68.72 Py= 23.66 Qy= 50.98 Pz= 60.42 Qz= 90.84 The government decides to: impose a 5 Rs/unit Tax on Y give a 10% subsidy on good Z. When the above policies are jointly implemented. Analyse the impact on equilibrium prices and quantities.The demand and supply functions for three (03) goods are given as follows: Dx = 100-3Px+Py+3Pz Dy = 80+Px-2Py-Pz Dz = 120+3Px-Py-4Pz Sx = -10+Px Sy = -20+3Py Sz = -30+2Pz The equilibrium prices and quantities of all three goods are: Px= 78.72 Qx= 68.72 Py= 23.66 Qy= 50.98 Pz= 60.42 Qz= 90.84 The government decides to: a) impose a 25% Tax on X b) impose a 5 Rs/unit Tax on Y c) give a 10% subsidy on good z Analyze the impact of each of these policies seperately on equilibrium prices and quantities.
- Q3Use a matrix method to find the equilibrium prices and quantities where the supply and demand functionsfor Good 1, Good 2 and Good 3 are asQd1 = 50 − 2P1 + 5P2 − 3P3, Qs1 = 8P1 − 5Qd2 = 22 + 7P1 − 2P2 + 5P3, Qs2 = 12P2 − 5Qd3 = 17 + P1 + 5P2 − 3P3, Qs3 = 4P3 − 1Suppose that the demand and supply of liter of petrol are given in table 1 as per attachment What is the equilibrium price and quantity of petrol? Use a graph paper to draw a demand curve and supply curve based on the table above. Now suppose that a political crisis in the Middle East lead to a decrease in the supply of petrol by 8 liter per day at every price. Show the change in the graph paper and show the new equilibrium position. What is the new equilibrium price of petrol? What is the new equilibrium quantity of petrol? In order t o help the consumer, the government imposes a price control of RM0.60 per liter: Give the name of this price control. How much petrol will be demanded by consumer at this price?. How much petrol will be offered for sale by…3. Individual and market demand Suppose that Manuel and Poornima are the only consumers of pizza slices in a particular market. The following table shows their annual demand schedules: Price Manuel’s Quantity Demanded Poornima’s Quantity Demanded (Dollars per slice) (Slices) (Slices) 1 30 80 2 15 60 3 10 40 4 5 30 5 0 20 On the following graph, plot Manuel’s demand for pizza slices using the green points (triangle symbol). Next, plot Poornima’s demand for pizza slices using the purple points (diamond symbol). Finally, plot the market demand for pizza slices using the blue points (circle symbol). Note: Line segments will automatically connect the points. Remember to plot from left to right. Manuel’s DemandPoornima’s DemandMarket Demand020406080100120654321


