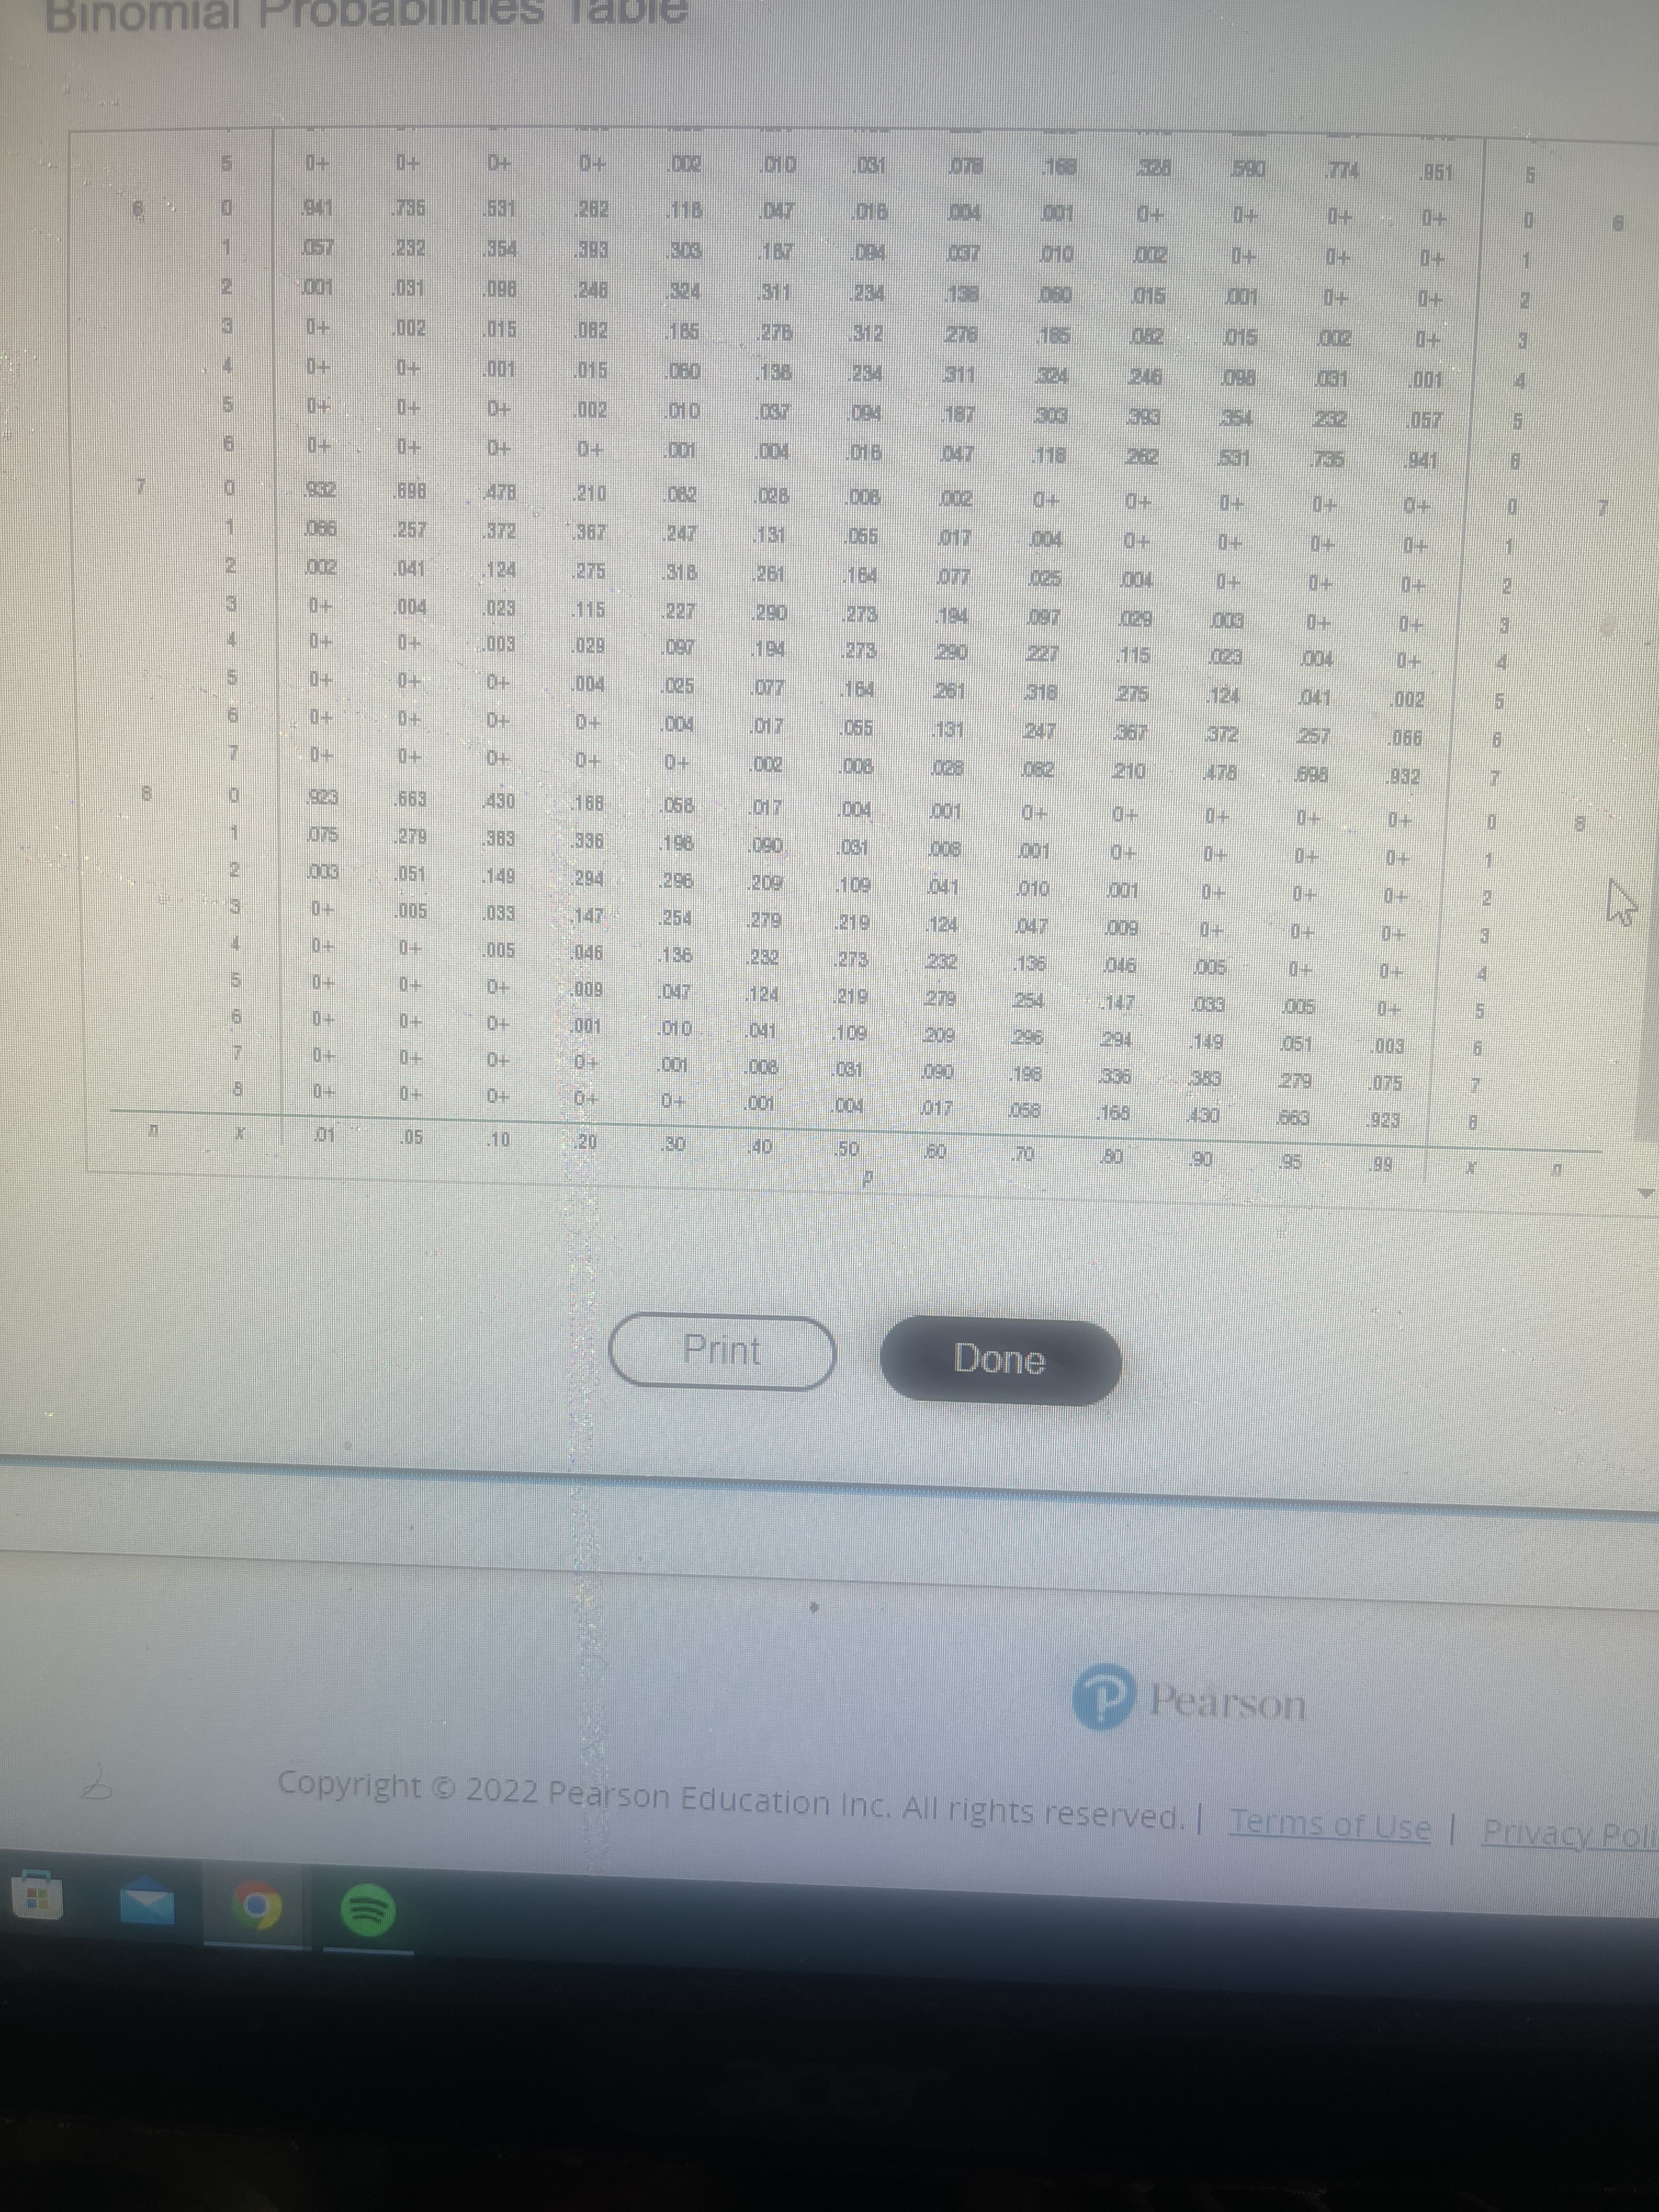
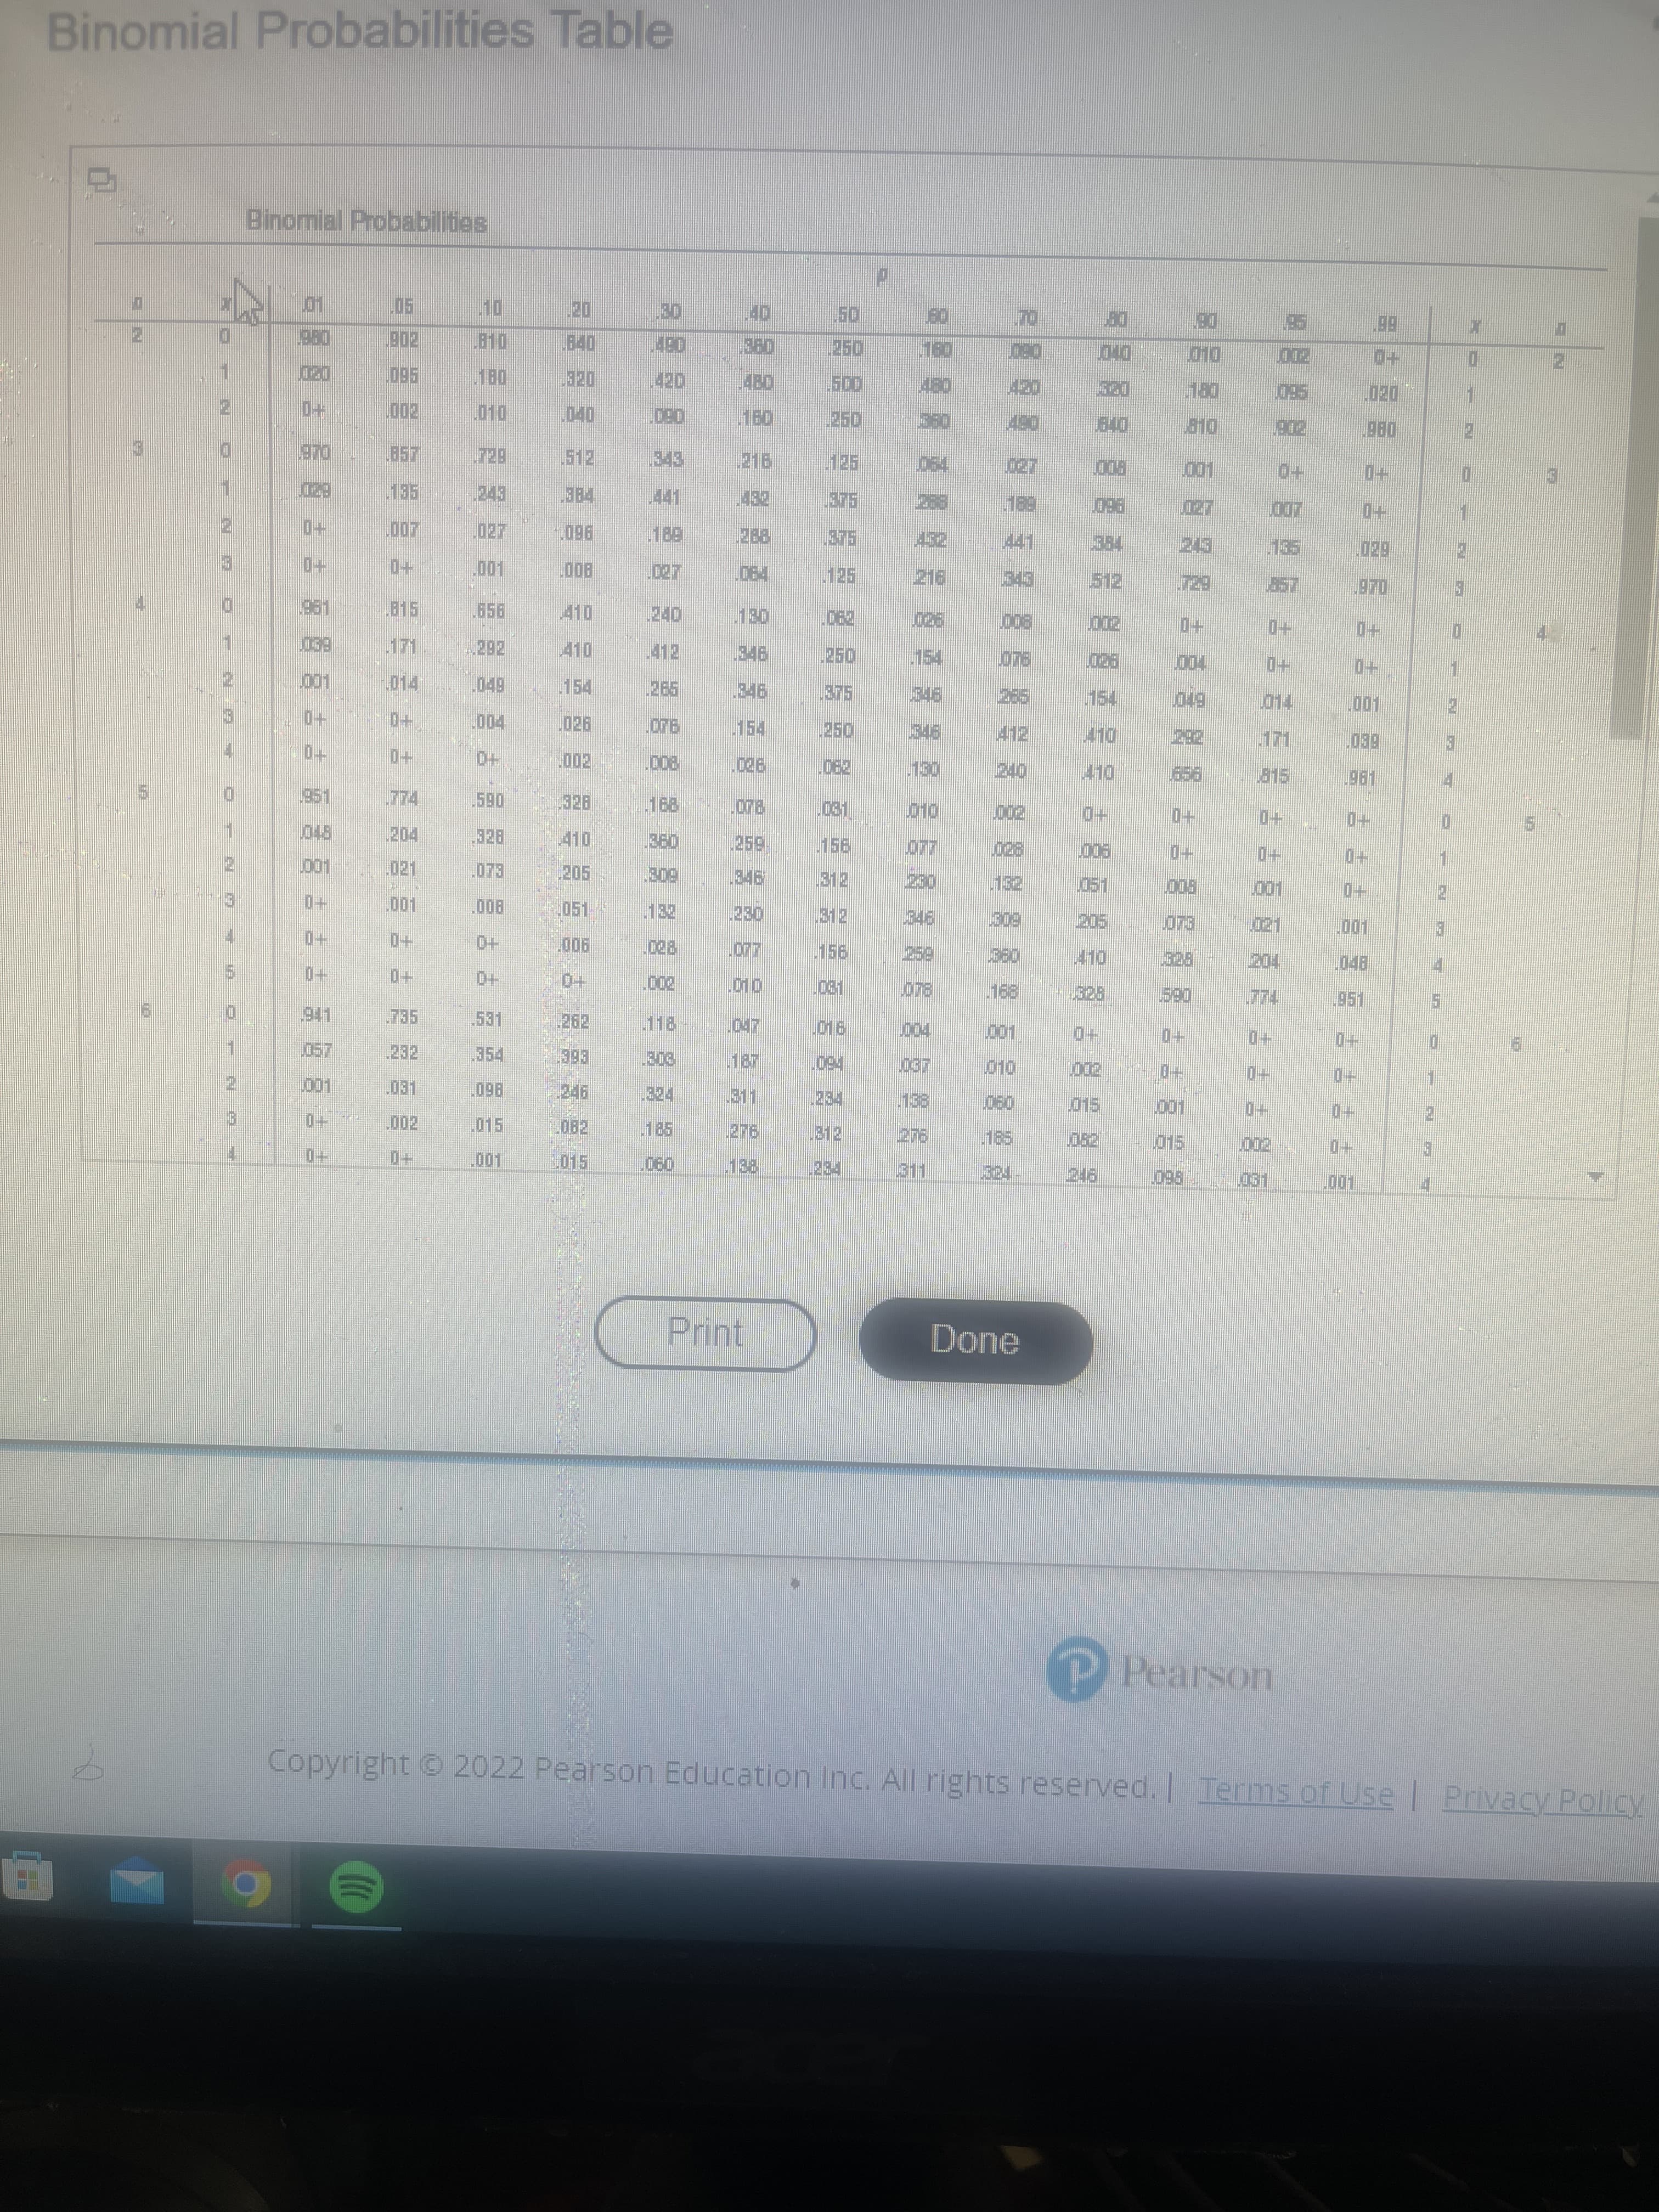
Assume that a procedure yields a binomial distribution with n=8 trials and a probability of success of p= 0.60. Use a binomial probability table to find the probability that the number of successes is exactly 3. Click on the icon to view the binomial probabilities table. P(3) = ____ (round to three decimal places as needed .
Q: A survey of homes in Whitehall, Ohio recorded the market value of the home (y) in dollars and the…
A: Given data predicted market value= -34778+94.2 (square feet)
Q: The score of STAT-2910 course out of 100 in Winter 2021 of 10 students are 48, 92, 47, 44, 94, 18,…
A: given tgat, the score of STAT-2910 course out of 100 in Winter 2021 of 10 students are 48, 92, 47,…
Q: A study was conducted to analyze the appearance of surgical site infections that occur in patients…
A: True value of the proportion lie in a range can be calculated using the confidence interval. It is…
Q: 3. Two methods of teaching statistics are being tried by a professor. A class of 40 students is…
A: Given: Sample size (n1) = 40 Sample size (n2) = 36 Sample mean X¯1= 78X¯2=74Population standard…
Q: In a test, the average score is 100. You believe that the average score for your class is higher.…
A: It is given that Sample size n = 30 Sample mean = 140 Sample SD = 15 Level of significance = 0.05
Q: A random sample of male college baseball players and a random sample of male college soccer players…
A: From the provided information, Sample size (n1) = 25 and n2 = 25 Level of significance (α) = 0.05
Q: Two independent groups of students were selected to participate in a study to determine if having…
A: Given that x-bar1 = 87, s1 = 1.8, n1 = 30, x-bar2 = 86, s2 = 3.2, n2 = 33,
Q: Requirced. Oring 1% level Consumer prepecences For the Four 7 Significanse test the mull hypthests…
A: Test is that whether the consumer preferences for the four brands are equal
Q: The President of the University of Michigan would like to know more about students on campus. He…
A:
Q: 5. The following is the data collected on the number of employees according to their monthly salary.…
A:
Q: QUESTION 8 Amy rolls a die that she suspects is unfair a total of 500 times and records the results…
A:
Q: The correlation coefficient is r= . (b) The equation of the least squares line is y^=
A:
Q: statistical test) was conducted to determine the effects of (name of the IV) on (name of the DV).…
A: Hi! Thank you for the question, As per the honor code, we are allowed to answer three sub-parts at a…
Q: The average number of blood clots per 100000 people from a type of Covid-19 vaccine is 1.1. a) Find…
A: From the given information, the average number of blood clots per 100000 people from a type of…
Q: A study was conducted to analyze the appearance of surgical site infections that occur in patients…
A:
Q: A sample of college students is surveyed in order to learn more about how GPA is associated with the…
A: Given that Correlation coefficients r. r=0.50
Q: A survey was conducted of two types of marketers. The first type being marketers that focus…
A: Given : X1 = 518X2 = 250n1 = 589n2 = 407P1^ = 0.88P2^ = 0.61 Pooled proportion : P = x1+x2n1+n2…
Q: e following results come from two independent random samples taken of two populations. Sample 1…
A:
Q: A newsgroup is interested in constructing a 95% confidence interval for the proportion of all…
A: Given that Sample size n =506 Favorable cases x =411 Sample proportion p^=x/n =411/506 =0.8123
Q: In the population, the average IQ is 100 with a standard deviation of 15. A team of scientists wants…
A: We have given that The a random IQ = 100 standard deviation = 15 Sample mean = 140 Sample size = 30
Q: In a population with a mean of µ = 30 and a standard deviation of σ = 5, a score of X = 18 would be…
A: Given that μ=30 , σ=5 , X=18
Q: Find the area under the standard normal curve to the right of z = 1.67.
A:
Q: %) of B2B and 246(59%) of B2C marketers commonly use a business social media tool. The study also…
A: Two types of Marketers B2B B2C Marketers count B2B 590 B2C 420 Business Social…
Q: Drill lifetime: A sample of 50 drills had a mean lifetime of 12.54 holes drilled when drilling a…
A:
Q: A marketing researcher wants to estimate the mean amount spent ($) on a certain retail website by…
A: Given Sample size n=94, sample mean x̄=1300, sample standard deviations s=350
Q: A regression model to predict Y, the state burglary rate per 100,000 people, used the following four…
A: a) The number of independent variables is 4. The sample size n is 45. The degrees of freedom is…
Q: Cigarettes smoked per day x: 60, 30, 24, 12, 45, 33, 52, 20, 10 Age of death y: 55, 80, 78, 88, 51,…
A: Note: As per my policy i can answer only one question. kindly repost the remaining ones. Given data…
Q: Find a 92% confidence interval for µ1 − µ2 if the data are taken from two independent normal…
A:
Q: (b) The average operating life of light bulbs produced by Company A is 8100 hours and a standard…
A: Given that, For company A, Mean, u1= 8100 Standard deviation, σ1= 400 Sample size, n1= 60 Let X1…
Q: The median of the probability distribution of a random variable X is that value m which makes the…
A:
Q: f n=29, x¯(x-bar)=31, and s=8, construct a confidence interval at a 90% confidence level. Assume the…
A:
Q: confidence intervals and sample size if a sample of 48 has a sample mean of 416 and a standard…
A: From the provided information, Sample size (n) = 48 Sample mean (x̄) = 416 Sample standard deviation…
Q: A pamphlet published by AAA gave the following information on vehicle speed (in miles per hour) and…
A:
Q: a. Complete the table (Use 4 decimal places when applicable) b. What is the cumulative relative…
A: here given , frequency table for # of times floss per week (x)
Q: A random sample of 23 items is drawn from a population whose standard deviation is unknown. The…
A: Given that Sample size n =23 Sample mean =840 Standard deviation =15
Q: A 95% confidence interval for a population proportion is calculated to be from 0.38 to 0.50. This…
A: We have given that, Confidence interval for population proportion (P) = 0.38 to 0.50. Then, We…
Q: Gasoline is to be stocked in a bulk tank once at the beginning of each week and then sold to…
A:
Q: Pairs of P-values and significance levels, a, are given. For each pair, state whether you would…
A: Given that A) P-value=0.084 , at ?= 0.05 B) P-value=0.003 , at ?= 0.001 C) P-value=0.498 , at ?=…
Q: sampling?
A:
Q: A biologist is attempting to determine the mean weight of African elephants. She conducts a sample…
A: It is given that sample mean is 8311 and the sample standard deviation is 127.
Q: Giving a test to a group of students, the grades and gender are summarized below Grades vs. Gender А…
A:
Q: SOLVE FOR THE FOLLOWING with complete solution: 1, 2, 2, 3, 4, 4, 5, 6, 7, 8, 8, 9, 11, 13, 15,…
A:
Q: S. S2 for t = - 1.78, s, = 0.83, s2 = 0.57, n, = 33, and n2 = 34. n2 %3D %3D Evaluate E=t - E =…
A:
Q: Evaluate: 2 51(0.5)(-1
A: Statistics is the branch of applied mathematics.
Q: 5, population & skewness sample and its e
A: Class interval Frequency 6.5-12.5 3 12.5-18.5 6 18.5-24.5 5 24.5-30.5 4 30.5-36.5 2…
Q: A musicologist is attempting to determine the mean length of modern pop songs. She conducts a sample…
A:
Q: Home Ownership Rates The percentage rates of home ownership for 6 randomly selected states are…
A: Data given 73.7,73.8,69.4,74.5,60.1,67.6
Q: A team of doctors would like to compile a report measuring diastolic blood pressure in their…
A:
Q: The frequency table shows the mass in kilogram, collected from a class. Mass (kg) No. of students…
A:
Q: 10. In the past, a machine has produced washers having a thickness of 0.050 inch (in). To determine…
A: Given Information: Meanx¯=0.053Standard deviations=0.003Sample size (n)=10
Assume that a procedure yields a binomial distribution with n=8 trials and a
Trending now
This is a popular solution!
Step by step
Solved in 2 steps
- Commercial Residential4.05 9.975.53 5.863.14 8.135.18 5.944.72 8.892.71 3.943.38 8.083.38 8.594.53 10.656.24 6.620.46 5.445.03 4.096.64 6.456.37 9.983.72 5.36It has been suggested that daily production of a subassembly would be increased if better lighting were installed and background music and free coffee and doughnuts were provided during the day. Management agreed to try the scheme for a limited time. A listing of the number of subassemblies produced per week before and after the new work environment for each employee follows. Employee Past Production Record Production after Installing, Lighting, Music, etc. JD 23 33 SB 26 26 MD 24 30 RCF 17 25 MF 20 19 UHH 24 22 IB 30 29 WWJ 21 25 OP 25 22 CD 21 23 PA 16 17 RRT 20 15 AT 17 9 QQ 23 Show your work, please. Thanks!It has been suggested that daily production of a subassembly would be increased if better lighting were installed and background music and free coffee and doughnuts were provided during the day. Management agreed to try the scheme for a limited time. A listing of the number of subassemblies produced per week before and after the new work environment for each employee follows. Employee Past Production Record Production after Installing, Lighting, Music, etc. JD 23 33 SB 26 26 MD 24 30 RCF 17 25 MF 20 19 UHH 24 22 IB 30 29 WWJ 21 25 OP 25 22 CD 21 23 PA 16 17 RRT 20 15 AT 17 9 QQ 23 30 FIND: State the decision rule and show your work: Reject H0 if T ≤ : Compute T and arrive at a decision (Show your work). T = ____________ , do not reject H0.
- Household Paper Plastic1 3.27 0.632 2.41 1.133 11.42 12.814 7.98 6.095 6.33. 3.866 12.32 11.177 6.96 7.608 16.39 9.709 6.83 3.5710 5.86 3.9111 9.41 3.3612 6.44 8.4013 14.33. 6.4314 2.80 5.9215 16.08 14.3616 6.05 2.7317 13.61 8.9518 12.73. 14.8319 9.55 9.2020 6.16 5.8821 6.67 6.0922 7.72 3.8623 15.09 9.1124 8.82 11.8925 11.08 12.4726 13.05 12.3127 9.83 6.2628 7.57 5.9229…Date DJIA S&P 500 Day 1 35405.24 4536.54 Day 2 35629.33 4579.38 Day 3 35111.16 4467.44 Day 4 35089.74 4510.53 Day 5 35091.13 4493.87 Day 6 35462.78 4511.54 Day 7 35768.06 4577.18 Day 8 35241.59 4514.08 Day 9 34738.06 4408.64 Day 10 34566.17 4411.67 Day 11 34988.84 4461.07 Day 12 34934.27 4485.01 Day 13 34312.03 4390.26 Day 14 34079.18 4358.87 Day 15 33596.61 4314.76 Day 16 33131.76 4235.50 Day 17 33223.83 4278.70 Day 18 34058.75 4394.65 Day 19 33892.60 4363.94 Day 20 33294.95 4316.26 Day 21 33891.35 4396.54 Day 22 33794.66 4353.49 Day 23 33614.80 4318.87 Day 24 32817.38 4211.09 Day 25 32632.64 4180.70 Day 26 33286.25 4287.88 Day 27 33174.07 4249.52 Day 28 32944.19 4194.31 Day 29 32945.24 4183.11 Day 30 33544.34 4252.45 Day 31 34063.10 4367.86 Day 32 34480.76 4421.67 Day 33 34754.93 4473.12 Day 34 34552.99 4471.18 Day 35 34807.46 4521.61 Day 36 34358.50 4466.24 Day 37 34707.94 4510.16 Day 38 34861.24 4553.06…Kentville, a community of 10,000 people, resides next to a krypton mine, and there is a concern that the emission from the krypton smelter have resulted in adverse effects. Specifically, Kryptonosis seems to have killed 12 of Kentville’s inhabitants last year. A neighboring community, Lanesburg, has 25,000 inhabitants and is far enough from the smelter to not be affected by the emission. In Lanesburg, only three people last year died of Kryptonosis. Given that the number of deaths in Kentville and their causes last year were: Heart attack=7 Accidents=4 Kryptonosis=12 Other=6 What is the risk of dying of Kryptonosis in Kentville relative to non-contaminated locality?What is the risk of dying of Kryptonosis in Kentville relative to deaths due to other causes? How many times the chance of dying of Kryptonosis compared to dying of accidents ? How many times the chance of dying of Kryptonosis compared to Other causes?
- Suppose the audience for the "Ellen Degeneres Show" was mainly LGBT people. Would this imply that these LGBT people are acting collectively?Judge Disposed Appealed Reversed Court Fred Cartolano 3037 137 12 Common Thomas Crush 3372 119 10 Common Patrick Dinkelacker 1258 44 8 Common Timothy Hogan 1954 60 7 Common Robert Kraft 3138 127 7 Common William Mathews 2264 91 18 Common William Morrissey 3032 121 22 Common Norbert Nadel 2959 131 20 Common Arthur Ney Jr. 3219 125 14 Common Richard Niehaus 3353 137 16 Common Thomas Nurre 3000 121 6 Common John O'Connor 2969 129 12 Common Robert Ruehlman 3205 145 18 Common J. Howard Sundermann Jr. 955 60 10 Common Ann Marie Tracey 3141 127 13 Common Ralph Winkler 3089 88 6 Common Total 43945 1762 199 -- Penelope Cunningham 2729 7 1 Domestic Patrick Dinkelacker 6001 19 4 Domestic Deborah Gaines 8799 48 9 Domestic Ronald Panioto 12970 32 3 Domestic Total 30499 106 17 -- Mike Allen 6149 43 4 Municipal Nadine Allen 7812 34 6 Municipal Timothy Black 7954 41 6 Municipal David Davis 7736 43 5 Municipal Leslie Isaiah Gaines 5282 35 13…Johnson Filtration, Inc. provides maintenance service for water-filtration systems. Suppose that in addition to information on the number of months since the machine was serviced and whether a mechanical or an electrical repair was necessary, the managers obtained a list showing which repairperson performed the service. Repair Time(hours) Months SinceLast Service Type ofRepair Repairperson 2.9 2 electrical Dave Newton 3.0 6 mechanical Dave Newton 4.8 8 electrical Bob Jones 1.8 3 mechanical Dave Newton 2.9 2 electrical Dave Newton 4.9 7 electrical Bob Jones 4.2 9 mechanical Bob Jones 4.8 8 mechanical Bob Jones 4.4 4 electrical Bob Jones 4.5 6 electrical Dave Newton Ignore for now the months since the last maintenance service (x1 ) and the repairperson who performed the service. Develop the estimated simple linear regression equation to predict the repair time (y) given the…
- plz provide handwritten answer for question 4 part c asap for getting upvoteNORTH–SOUTH AIRLINE CASENorthern Airline DataAirframe CostEngine CostAverage AgeYearper Aircraftper Aircraft(Hours)200151.8043.496,512200254.9238.588,404200369.7051.4811,077200468.9058.7211,717200563.7245.4713,2752006 84.7350.2615,215200778.7479.6018,390Southeast Airline DataAirframe CostEngine CostAverage AgeYearPer Aircraftper Aircraft(Hours)200113.2918.865,107200225.1531.558,145200332.1840.437,360200431.7822.105,773200525.3419.697,150200632.7832.589,364200735.5638.078,2591. Develop Regression equations for each cost category as dependent variables and average age as independent variables. Do this for each Airline. Look at graphs produced by QM2. From the regression results, what would you conclude about a) airframe vs engine costs for each airlineb) comparing airlines as to airframe costsc) comparing airlines as to engine costsd) Provide a brief summary report of your comparisons2. A research Development department at Oda manufacturing company determines that 20% of people who purchase their products during any given month will not purchase the next month. On the other hand, 30% of the people-who could not purchase during any given month will purchase in the next month. On a population of 1000 people 100 purchased their products this month. How many will purchase their product. A. In the long run?