Assume that a randomly selected subject is given a bone density test. Bone density test scores are normally distributed with a mean of 0 and a standard deviation of 1. Draw a graph and find Pg, the 8th percentile. This is the bone density score separating the bottom 8% from the top 92%. Which graph represents Pg? Choose the correct graph below. O D. C. О в. O A. P8 P8 P8 P8 The bone density score corresponding to Pg is- (Round to two decimal places as needed.) Click to 3. 3.
Assume that a randomly selected subject is given a bone density test. Bone density test scores are normally distributed with a mean of 0 and a standard deviation of 1. Draw a graph and find Pg, the 8th percentile. This is the bone density score separating the bottom 8% from the top 92%. Which graph represents Pg? Choose the correct graph below. O D. C. О в. O A. P8 P8 P8 P8 The bone density score corresponding to Pg is- (Round to two decimal places as needed.) Click to 3. 3.

Glencoe Algebra 1, Student Edition, 9780079039897, 0079039898, 2018
18th Edition
ISBN:9780079039897
Author:Carter
Publisher:Carter
Chapter10: Statistics
Section10.3: Measures Of Spread
Problem 26PFA

Related questions
Question
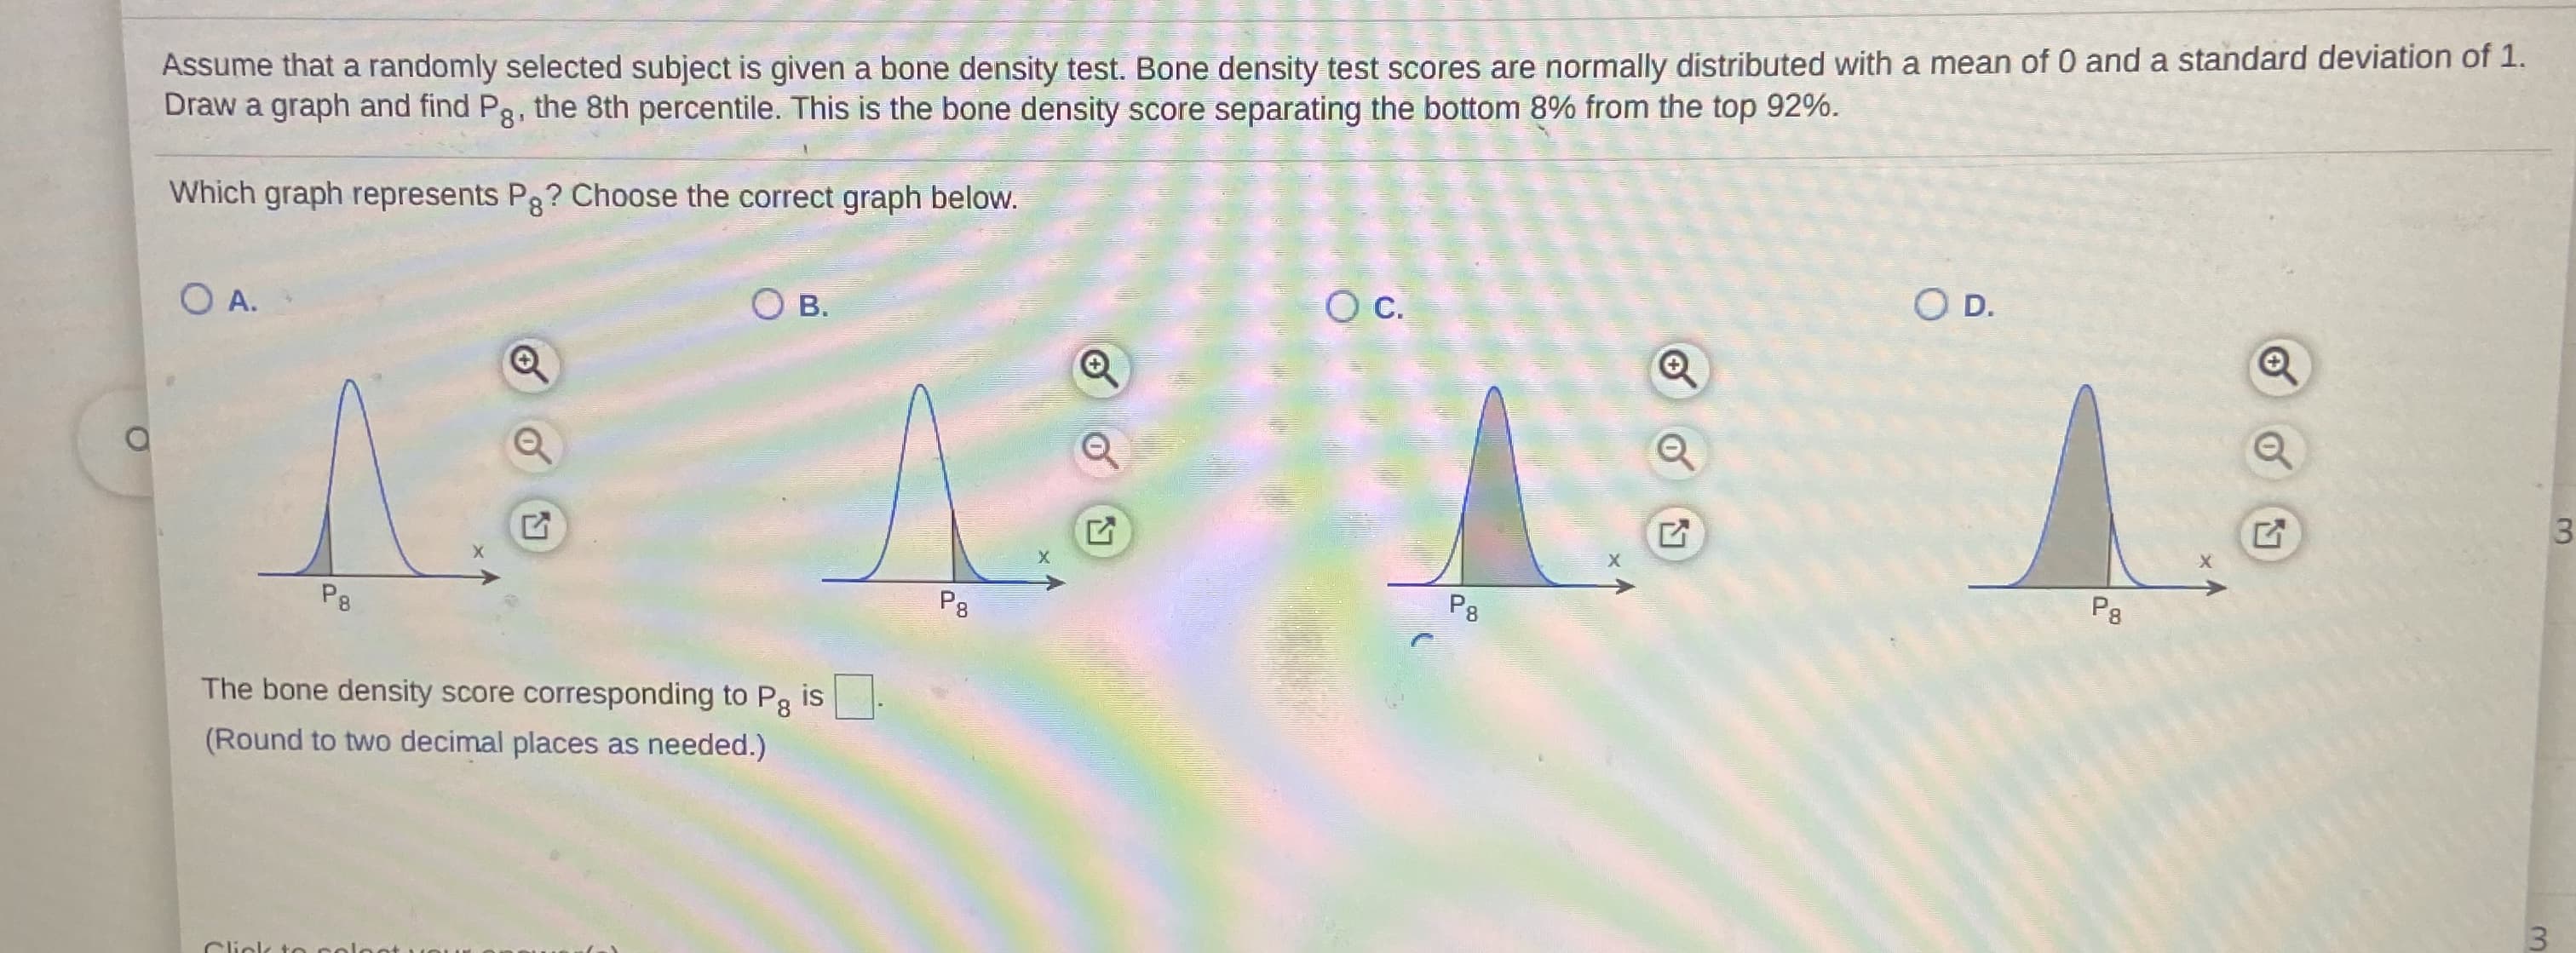
Transcribed Image Text:Assume that a randomly selected subject is given a bone density test. Bone density test scores are normally distributed with a mean of 0 and a standard deviation of 1.
Draw a graph and find Pg, the 8th percentile. This is the bone density score separating the bottom 8% from the top 92%.
Which graph represents Pg? Choose the correct graph below.
O D.
C.
О в.
O A.
P8
P8
P8
P8
The bone density score corresponding to Pg is-
(Round to two decimal places as needed.)
Click to
3.
3.
Expert Solution
This question has been solved!
Explore an expertly crafted, step-by-step solution for a thorough understanding of key concepts.

This is a popular solution!

Trending now
This is a popular solution!

Step by step
Solved in 2 steps with 2 images

Recommended textbooks for you
Glencoe Algebra 1, Student Edition, 9780079039897…
Algebra
ISBN:
9780079039897
Author:
Carter
Publisher:
McGraw Hill
Glencoe Algebra 1, Student Edition, 9780079039897…
Algebra
ISBN:
9780079039897
Author:
Carter
Publisher:
McGraw Hill