The graph illustrates the distribution of test scores taken by College Algebra students. The maximum possible score on the test was 140, while the mean score was 76 and the standard deviation was 14. 34 48 62 76 90 104 118
The graph illustrates the distribution of test scores taken by College Algebra students. The maximum possible score on the test was 140, while the mean score was 76 and the standard deviation was 14. 34 48 62 76 90 104 118

Glencoe Algebra 1, Student Edition, 9780079039897, 0079039898, 2018
18th Edition
ISBN:9780079039897
Author:Carter
Publisher:Carter
Chapter10: Statistics
Section10.3: Measures Of Spread
Problem 26PFA

Related questions

Question
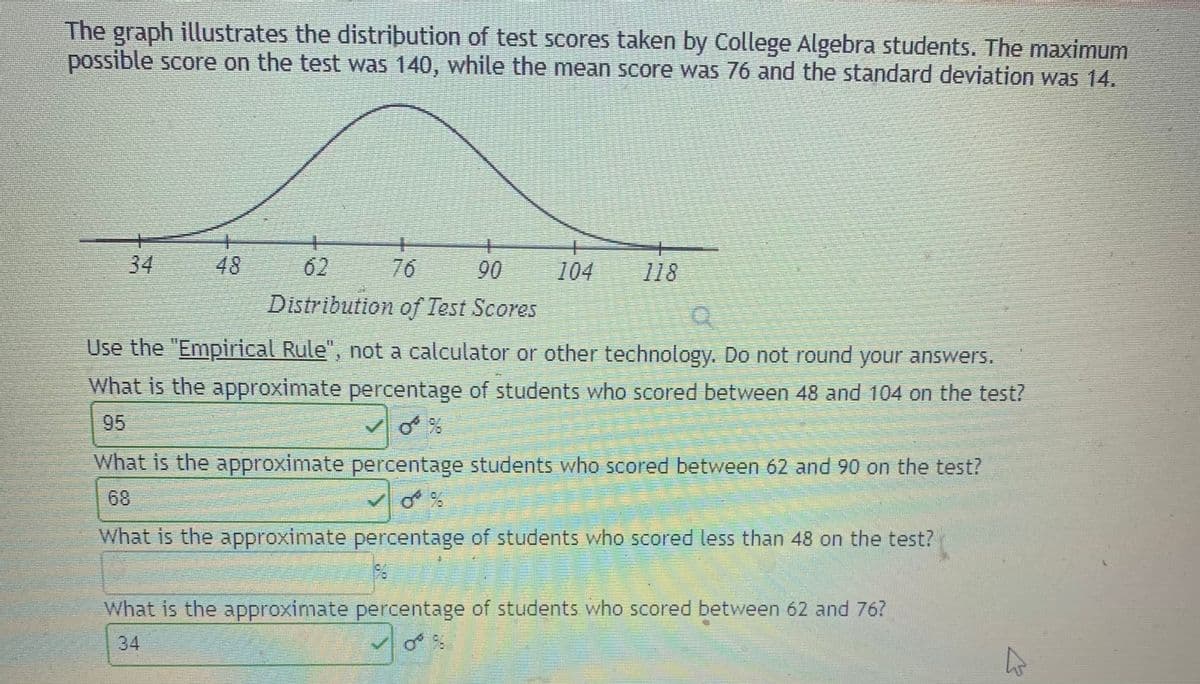
Transcribed Image Text:The graph illustrates the distribution of test scores taken by College Algebra students. The maximum
possible score on the test was 140, while the mean score was 76 and the standard deviation was 14.
34
48
62
76
90
104
118
Distribution of Test Scores
Use the "Empirical Rule", not a calculator or other technology. Do not round your answers.
What is the approximate percentage of students who scored between 48 and 104 on the test?
95
What is the approximate percentage students who scored between 62 and 90 on the test?
6.
What is the approximate percentage of students who scored less than 48 on the test?
What is the approximate percentage of students who scored between 62 and 76?
34
Expert Solution
This question has been solved!
Explore an expertly crafted, step-by-step solution for a thorough understanding of key concepts.

This is a popular solution!

Trending now
This is a popular solution!

Step by step
Solved in 2 steps

Knowledge Booster


Learn more about
Need a deep-dive on the concept behind this application? Look no further. Learn more about this topic, statistics and related others by exploring similar questions and additional content below.Recommended textbooks for you
Glencoe Algebra 1, Student Edition, 9780079039897…
Algebra
ISBN:
9780079039897
Author:
Carter
Publisher:
McGraw Hill
Glencoe Algebra 1, Student Edition, 9780079039897…
Algebra
ISBN:
9780079039897
Author:
Carter
Publisher:
McGraw Hill