Assume that a randomly selected subject is given a bone density test. Those test scores are normally distributed with a mean of 0 and a standard deviation of 1. Draw a graph and find the bone density test scores that can be used as cutoff values separating the lowest 2% and highest 2%, indicating levels that are too low or too high, respectively. Sketch the region. Choose the correct graph below. OA. The bone density scores are (Use a comma to separate answers as needed. Round to two decimal places as needed.)
Assume that a randomly selected subject is given a bone density test. Those test scores are normally distributed with a mean of 0 and a standard deviation of 1. Draw a graph and find the bone density test scores that can be used as cutoff values separating the lowest 2% and highest 2%, indicating levels that are too low or too high, respectively. Sketch the region. Choose the correct graph below. OA. The bone density scores are (Use a comma to separate answers as needed. Round to two decimal places as needed.)

Glencoe Algebra 1, Student Edition, 9780079039897, 0079039898, 2018
18th Edition
ISBN:9780079039897
Author:Carter
Publisher:Carter
Chapter10: Statistics
Section: Chapter Questions
Problem 22SGR

Related questions
Topic Video
Question
Please help me
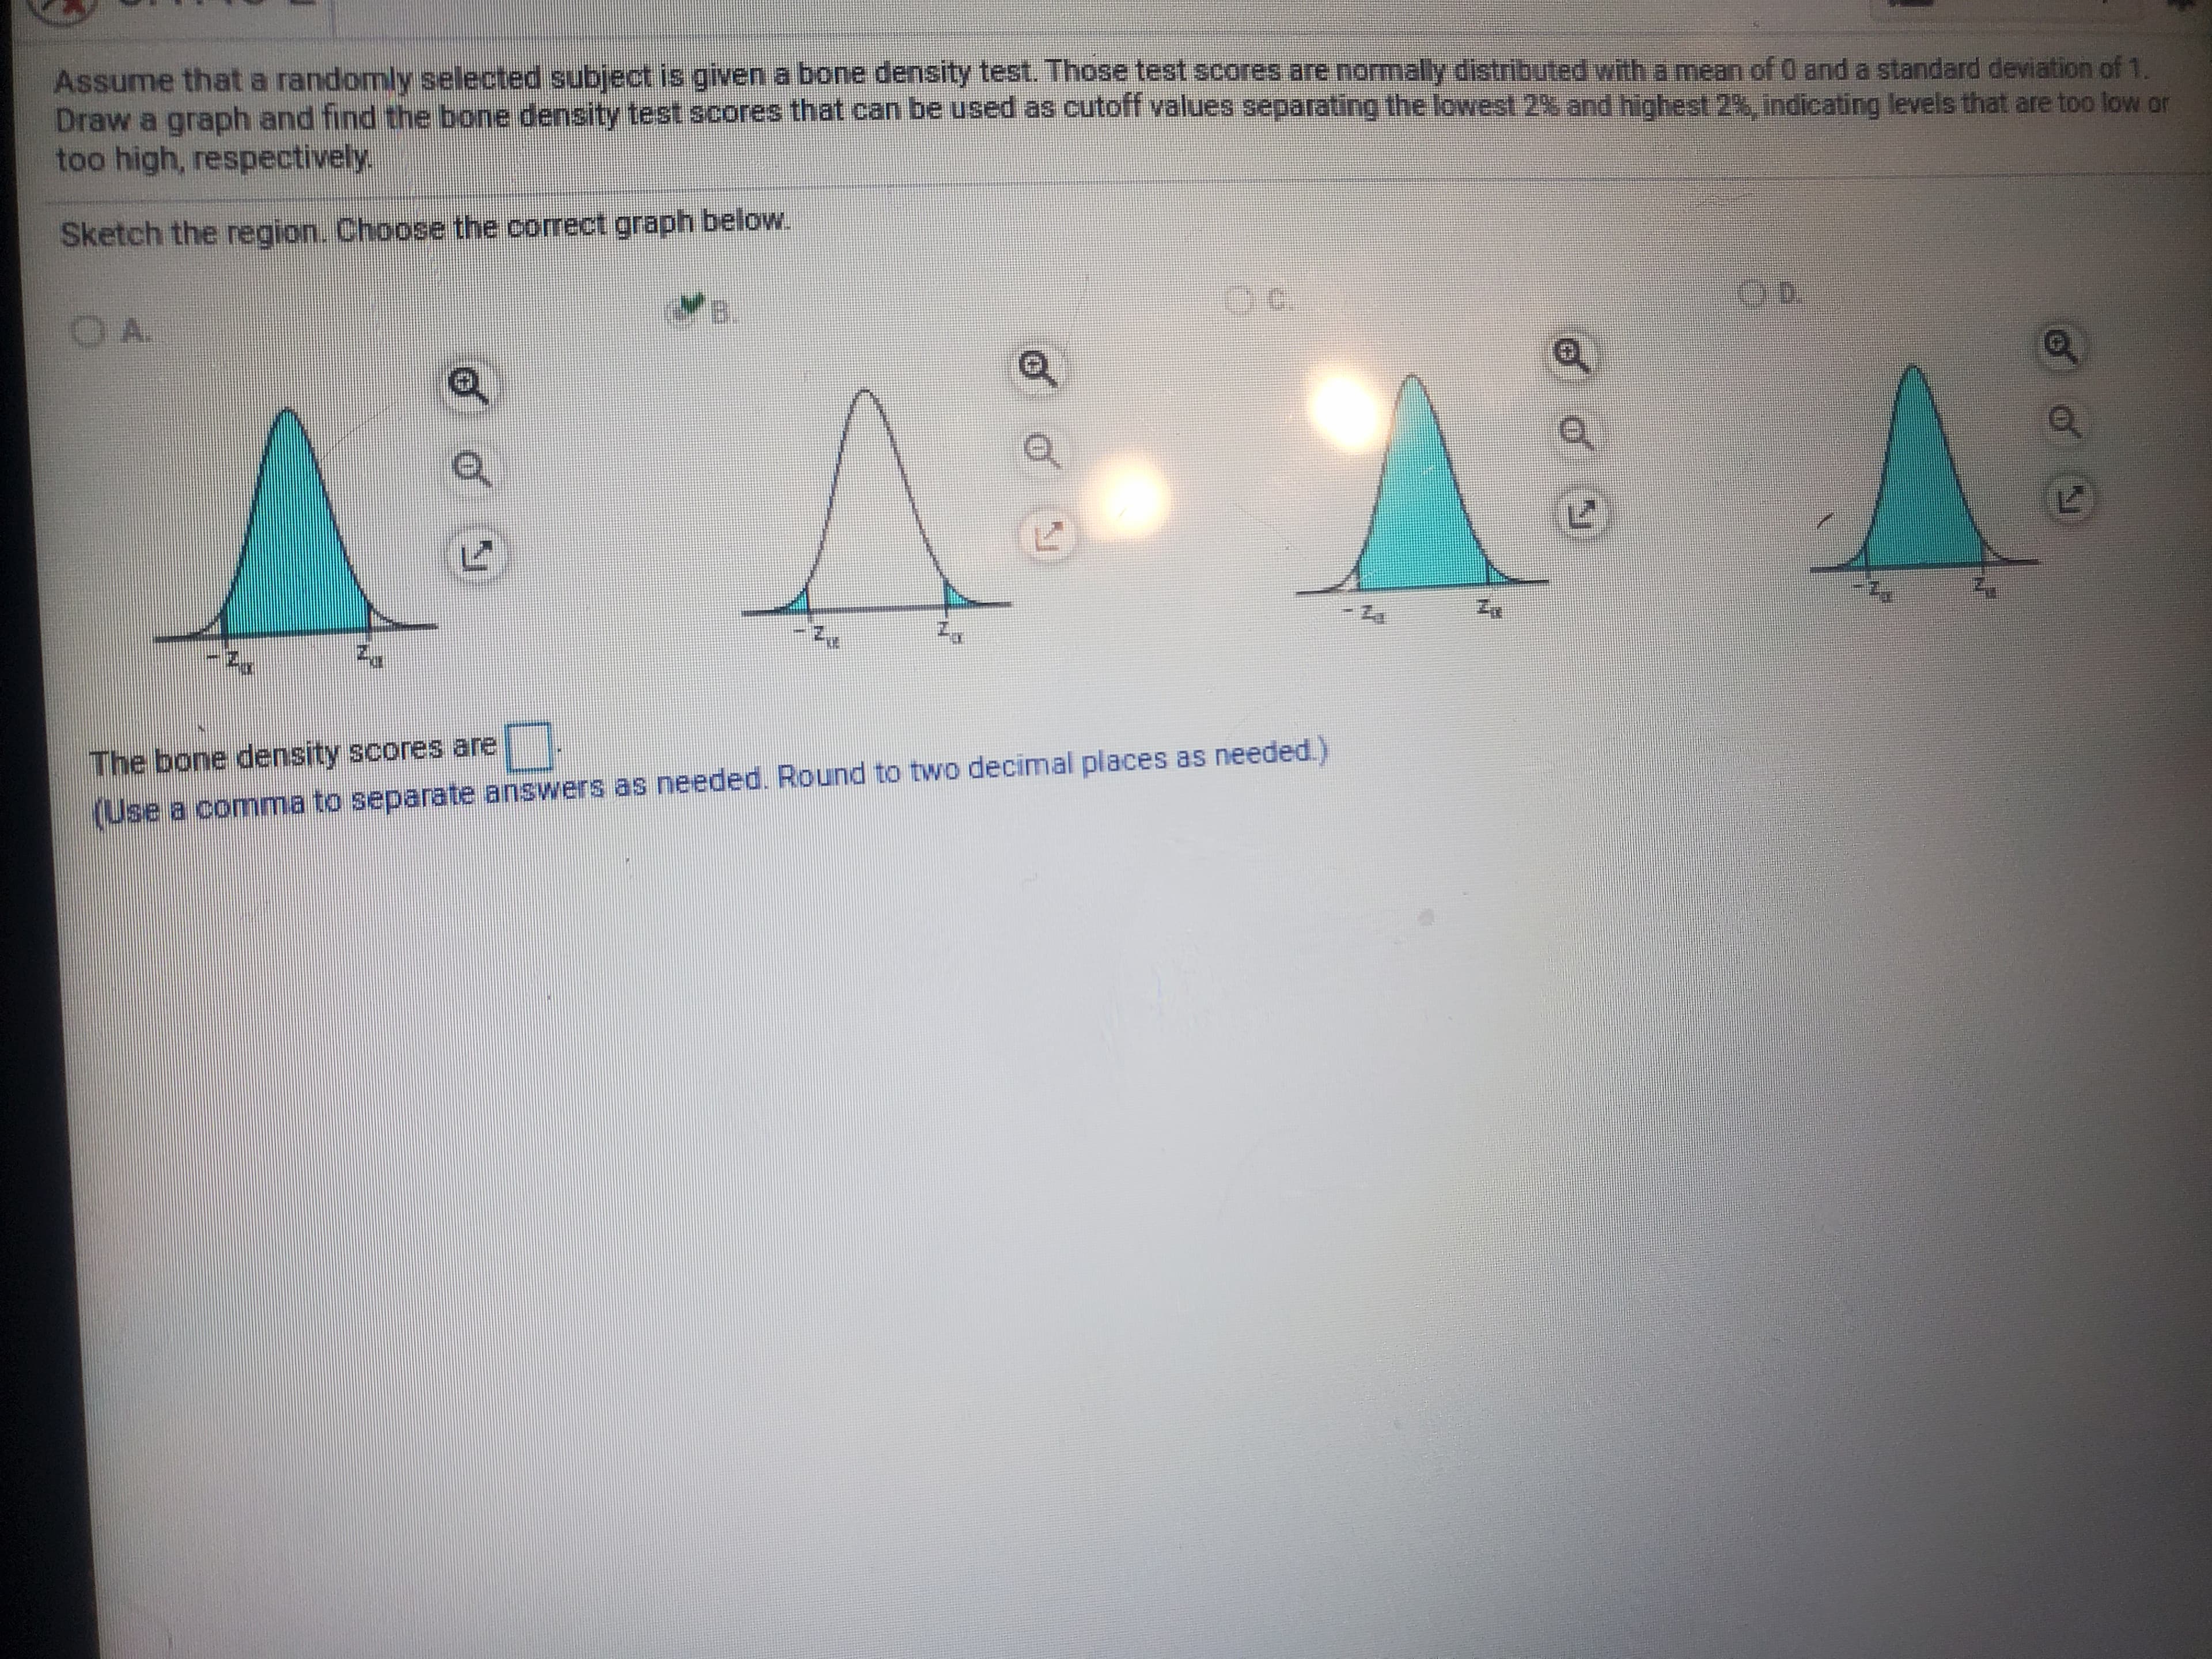
Transcribed Image Text:Assume that a randomly selected subject is given a bone density test. Those test scores are normally distributed with a mean of 0 and a standard deviation of 1.
Draw a graph and find the bone density test scores that can be used as cutoff values separating the lowest 2% and highest 2%, indicating levels that are too low or
too high, respectively.
Sketch the region. Choose the correct graph below.
OA.
The bone density scores are
(Use a comma to separate answers as needed. Round to two decimal places as needed.)
Expert Solution
This question has been solved!
Explore an expertly crafted, step-by-step solution for a thorough understanding of key concepts.

This is a popular solution!

Trending now
This is a popular solution!

Step by step
Solved in 3 steps with 1 images

Knowledge Booster


Learn more about
Need a deep-dive on the concept behind this application? Look no further. Learn more about this topic, statistics and related others by exploring similar questions and additional content below.Recommended textbooks for you
Glencoe Algebra 1, Student Edition, 9780079039897…
Algebra
ISBN:
9780079039897
Author:
Carter
Publisher:
McGraw Hill
Glencoe Algebra 1, Student Edition, 9780079039897…
Algebra
ISBN:
9780079039897
Author:
Carter
Publisher:
McGraw Hill