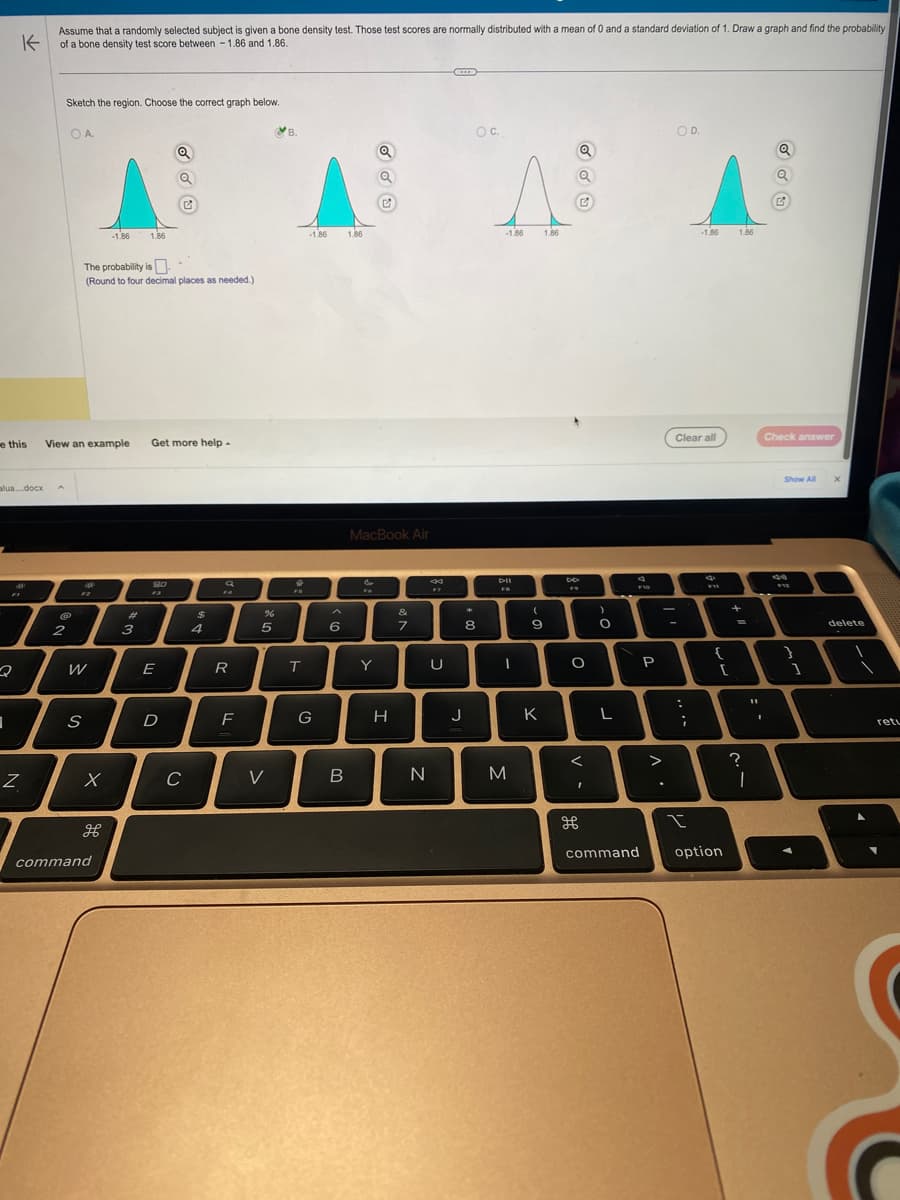
= Assume that a randomly selected subject is given a bone density test. Those test scores are normally distributed with a mean of 0 and a standard deviation of 1. Draw a graph and find the probability of a bone density test score between - 1.86 and 1.86.
Q: Find the area of the shaded region. The graph depicts the standard normal distribution of bone…
A: Given that. X~N( 0 , 1 ) μ=0 , ?=1 (for standard normal distribution) Z-score =( x - μ )/?
Q: Let x = red blood cell (RBC) count in millions per cubic millimeter of whole blood. For healthy…
A: Note- Since you have posted a question with multiple sub-parts, we will solve the first three…
Q: Maple Leaf Foods owns two machines (machine A and machine B) that operate independently of each…
A:
Q: confidence interval
A:
Q: What type of pattern exists? The time series plot shows a cyclical pattern. The time series plot…
A: a) Time series Plot: Excel Procedure: Enter the data for Period and Price in Excel sheet Select the…
Q: The flight time between two cities follows a uniform distribution, between 55 minutes and 75…
A: Let x be the flight time between two cities.x follows a uniform…
Q: Birthweights are distributed Normally, with a mean of 3.39kg and a standard deviation of 0.55kg…
A: Answer:- Given X ~ N(μ, σ ) Where mean μ = 3.39kg & standard…
Q: Suppose a population has a variance of 3. If we multiply every score in the population by -4, what…
A: We have given information, Let the random variable xi denote as score values. The population…
Q: Is there any significant evidence that the the alternative hypothesis is true?
A: Given that, The hypothesis for the test is, H0:Md=0 Vs H1:Md>0 n=15 T- = 19…
Q: Given this, what fraction of NHL players (who played an 82 game season) scored more than 45 goals?…
A: Let X be the random variable that scores the NHL player. Given that, X~N(μ=42, σ=8)
Q: Monitors Captions & Subtitles Chi-square analysis - Goodness of fit In the laboratory, a genetics…
A: Given data : 792 long-winged flies 208 dumpy-winged flies The tested hypothesis trait performing x2…
Q: (c) Let = 1 refer to the observation in quarter 1 of year 1; t = 2 refer to the observation in…
A: a) Time Series plot: Excel Procedure: Enter the data for sales in Excel. Select the data of sales…
Q: Let x denote the amount of gravel sold (in tons) during a randomly selected week at a particular…
A: Let, X: the amount of gravel sold (in tons) Given: f(x) = 2 (1-x) 0 ≤ x ≤ 10…
Q: s). What is the shape of the distribution of the collected data?
A: The variable under consideration is reaction time. Given that, Mean = 6 Median = 14 Mode = 5 Discuss…
Q: The economic dynamism, which is the index of productive growth in dollars for countrie that are…
A: It is given that the middle income of 27 countries which are designated by the world bank. We need…
Q: Refer to the accompanying data set and construct a 90% confidence interval estimate of the mean…
A: Let X be the pulse rate of adult females. Y is the pulse rate of adult males. Confidence level (C) =…
Q: he heights of European 13-year-old boys can be approximated by a normal model with mean ? of 63.7…
A: approximetly normal distributionμ=63.7σ=2.53we have to find out the probability for the given data.
Q: Given the following VENN Diagram answer the following. A. P(A/B)(Decimal: B. P(BIA)Decimal: C.…
A: we have to find given probabilities
Q: IV: levels of stress DV: self rated anxiety low stress high stress 1…
A: Introduction SPSS is a statistical software that helps in analyzing the data using statistical…
Q: Consider a population consisting of the following five values, which represent the number of video…
A: Hi thank you for posting this question , since you have posted multiple subparts as per our…
Q: A progressive college experiments with matching roommates at random, regardless of gender or how…
A: The question is about conditional probability Given joint prob. distribution : To find : Knowing…
Q: The amount of time it takes Renee to go grocery shopping is continuous and uniformly distributed…
A: Given that X~U(a,b) a=18.5 , b=40.5
Q: A statistics professor gave a final exam to a class of 30 students. The exam scores are normally…
A: Given,mean(μ)=75standard deviation(σ)=10
Q: (d) Considering only offices without a wait tracking system, what is the z-score for the tenth…
A: Here, we just have to solve question starting from d as instructions is given.
Q: The data in the given table gives the automobile fatality rates (deaths per 10,000 vehicles in use)…
A: Given data gives the automobile fatality rates (deaths per 10,000 vehicles in use) in 2016 for the…
Q: There are some temperature measurements of this month in San Francisco and Fresno. The sample size…
A: Sample means and sample variances of temperature are given for the countries San Francisco and…
Q: sing the t-table: If you have 18 df and your test statistic is 0.95, how much is in the right-tail?…
A: GIVEN DATA, df=18test statistics=0.95right tailed test we have to find out the p-value for the given…
Q: Based on the sample data of four different brands of chocolate chip cookies, it is desired to test…
A: Given information: Brand A Brand B Brand C Brand D 229 200 117 128 118 124 80 110 246 223…
Q: Assume that we want to construct a confidence interval. Do one of the following, as appropriate: (a)…
A: Answer:- Given that n = 238 , s = 7.2 , x̄ = 28.6 95% confidence level
Q: Confirm test results in part (c) using JASP.
A: First Enter the data in Excel.
Q: A life insurance company sells a $250,000 life insurance policy to a 30-year-old woman for $220.…
A: X is a discrete random variable. The mean of X is defined as EX=∑xPX=x
Q: In a study of government financial aid for college students, it becomes necessary to estimate the…
A: given data E = 0.0195% ci for pn = ?
Q: Most engaged couples expect or at least hope that they will have high levels of marital…
A: Given : For African-American Couples, mean = 26.3, std. deviation = 8, sample = 25For Latino…
Q: College costs El Dorado Community College considers a student to be full-time if he or she is taking…
A: The random variable T defines the tuition charge for the chosen student.
Q: A study indicates that 67% of students have have a laptop. You randomly sample 7 students. Find the…
A: Given that, The random variable X students have a laptop The probability of success is 0.67 p=0.67…
Q: Consider a sample with data values of 20, 24, 26, 15, 30, 34, 27, and 24. Compute the range.…
A: We have given that, The data set are :- 20, 24, 26, 15, 30, 34, 27, and 24
Q: Suppose I rolled a dice 10 times. My observations are summarized by the frequency table below. What…
A: Given that: Score Frequency one 3 two 2 three 2 four 1 five 1 six 1
Q: To determine the average length of hospital stay for patients who were hospitalized with and…
A: The objective is to define the population, parameter, sample, and statistic from the provided…
Q: 4. Sketch a dot plot for the variable Height. Describe the data distribution. 59 60 60 61 61 61 62…
A: Given data : 59 60 60 61 61 61 62 62 63 63 63 63 63 64 65 65 65 66 66 67
Q: . PLEASE PROVIDE JUST THE ANSWER THANK YOU. Please DO NOT waste time on writing things to explain.…
A:
Q: In this exercise, a randomization distribution is given for a hypothesis test, and shows what values…
A: In this case, To determine the likelihood of seeing a sample statistic as extreme as the given value…
Q: (c) What is the interpretation of the partial slope for Distance?
A: Given that, Dependent variable (y) = revenue generated by flights operating to the feeder cities.…
Q: A department of transportation's study on driving speed and miles per gallon for midsize automobiles…
A:
Q: If two dice are rolled once at the same time, what is the probability that the sum of the dots…
A: Know that S={ (1,1) (1,2) (1,3) (1,4) (1,5) (1,6) (2,1) (2,2) (2,3) (2,4) (2,5) (2,6) (3,1) (3,2)…
Q: The following data contains days when road rage occurred according to a study. The goal of the study…
A: The given data is as follows, Tu M W F W F F F Sa Su F Th Su F Tu…
Q: A 90% confidence interval for the population mean is 18 < mu < 24. What is the sample mean? Group of…
A: Answer:- Given , A 90% confidence interval (CI) for the population mean is 18 < mu < 24.…
Q: You may need to use the appropriate technology to answer this question. Consider the following data…
A: The question is about regression Given : To find : a ) To test signif. relation ship bet. Price…
Q: The 95% confidence interval is to This means that you are % confident that the unknown difference…
A: Given, n1=35, M1=2423 calories, s1=237 n2=40, M2=2679 calories, s2=256 Note that all answers were…
Q: m. Choose the correct graph below. 27 Q ecimal places as needed.) B. A 0.27 Q
A: Given that. X~N( 0 , 1 ) μ=0 , ?=1 (for standard normal distribution) Z-score =( x - μ )/?
Q: Find the indicated z score. The graph depicts the standard normal distribution with mean 0 and…
A: The question is standard normal distribution Given : Area to the right side of z = 0.8340 Popl. mean…
Trending now
This is a popular solution!
Step by step
Solved in 2 steps with 1 images