Assume that a randomly selected subject is given a bone density test. Those test scores are normally distributed with a mean of 0 and a standard deviation of 1. Fin probability that a given score is between -2.04 and 3.67 and draw a sketch of the region. Sketch the region. Choose the correct graph below. OA OB. -2.04 The probability is (Round to four decimal places as needed.) 2.04 OC. 2.04 3.67 OD. A 2.04 367
Assume that a randomly selected subject is given a bone density test. Those test scores are normally distributed with a mean of 0 and a standard deviation of 1. Fin probability that a given score is between -2.04 and 3.67 and draw a sketch of the region. Sketch the region. Choose the correct graph below. OA OB. -2.04 The probability is (Round to four decimal places as needed.) 2.04 OC. 2.04 3.67 OD. A 2.04 367

Glencoe Algebra 1, Student Edition, 9780079039897, 0079039898, 2018
18th Edition
ISBN:9780079039897
Author:Carter
Publisher:Carter
Chapter10: Statistics
Section10.3: Measures Of Spread
Problem 26PFA

Related questions
Question
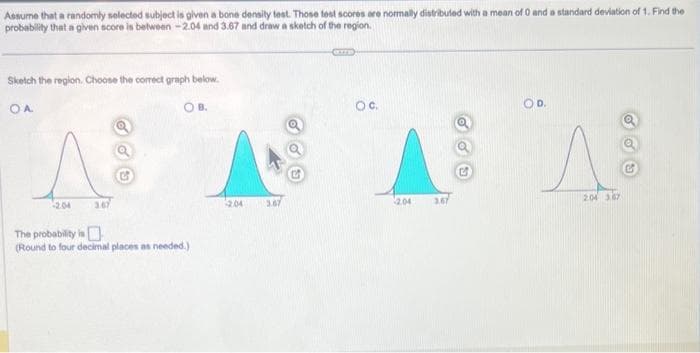
Transcribed Image Text:Assume that a randomly selected subject is given a bone density test. Those test scores are normally distributed with a mean of 0 and a standard deviation of 1. Find the
probability that a given score is between -2.04 and 3.67 and draw a sketch of the region.
Sketch the region. Choose the correct graph below.
OA
OB.
-2.04
3.67
The probability is
(Round to four decimal places as needed.)
2.04
GUTE
3.67
OC.
AAA
2.04
3.67
OD.
2.04 3.87
Expert Solution
This question has been solved!
Explore an expertly crafted, step-by-step solution for a thorough understanding of key concepts.

Step by step
Solved in 2 steps with 1 images

Recommended textbooks for you
Glencoe Algebra 1, Student Edition, 9780079039897…
Algebra
ISBN:
9780079039897
Author:
Carter
Publisher:
McGraw Hill
Glencoe Algebra 1, Student Edition, 9780079039897…
Algebra
ISBN:
9780079039897
Author:
Carter
Publisher:
McGraw Hill