Please use your understanding of community metrics to fill out the following table and answer the questions that follow. ommunity A Species Number of Individuals Total Individuals Number of species P In(p) pin(pi) H Ha 29 18 50 3 1. What is the H' for this community [Round to 3 decimal places 2. What is the Hmax for this community [Round to 3 decimal places 3. What is the J' for this community [Round to 3 decimal places rus carolinensis mias striatus Mus musculus teo jamaicensis
Please use your understanding of community metrics to fill out the following table and answer the questions that follow. ommunity A Species Number of Individuals Total Individuals Number of species P In(p) pin(pi) H Ha 29 18 50 3 1. What is the H' for this community [Round to 3 decimal places 2. What is the Hmax for this community [Round to 3 decimal places 3. What is the J' for this community [Round to 3 decimal places rus carolinensis mias striatus Mus musculus teo jamaicensis

College Algebra (MindTap Course List)
12th Edition
ISBN:9781305652231
Author:R. David Gustafson, Jeff Hughes
Publisher:R. David Gustafson, Jeff Hughes
Chapter4: Polynomial And Rational Functions
Section4.6: Rational Functions
Problem 11SC: Find the mean hourly cost when the cell phone described above is used for 240 minutes.

Related questions
Question
Please fill out table with work shown and questions below

Transcribed Image Text:Community A
Species
Number of Individuals Total Individuals Number of species P In(p) pin(pi) H
21.
Hmax
J'
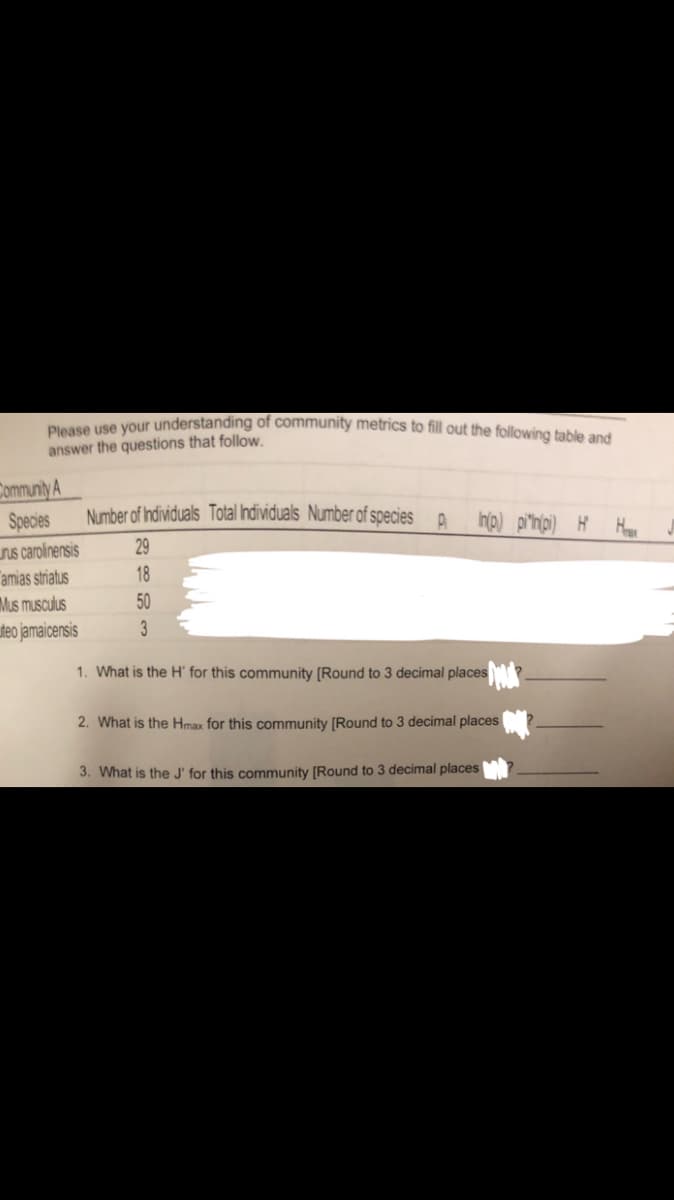
Transcribed Image Text:Please use your understanding of community metrics to fill out the following table and
answer the questions that follow.
Community A
Species
Number of Individuals Total Individuals Number of species p In(p) pinpi) H Hax
29
18
50
3
1. What is the H' for this community [Round to 3 decimal places
rus carolinensis
amias striatus
Mus musculus
teo jamaicensis
2. What is the Hmax for this community [Round to 3 decimal places
3. What is the J' for this community [Round to 3 decimal places
Expert Solution
This question has been solved!
Explore an expertly crafted, step-by-step solution for a thorough understanding of key concepts.

Step by step
Solved in 4 steps with 6 images

Recommended textbooks for you
College Algebra (MindTap Course List)
Algebra
ISBN:
9781305652231
Author:
R. David Gustafson, Jeff Hughes
Publisher:
Cengage Learning
College Algebra (MindTap Course List)
Algebra
ISBN:
9781305652231
Author:
R. David Gustafson, Jeff Hughes
Publisher:
Cengage Learning