Assume that a variable quality characteristic X follows a normal distribution. The current control charts used to monitor the behavior of this quality characteristic is the (X, RM) charts (also known as individual and moving-range charts) with a moving window of size 2. Their center lines for the two charts are X Chart Centerline = 10 RM Chart Centerline = 2.256 • Part (a): What is the value of sigma o? • Part (b): What is the upper control limit of the X chart? • Part (c): What should the CUSUM control limits be if k = 0.5 and h = 5? %D
Assume that a variable quality characteristic X follows a normal distribution. The current control charts used to monitor the behavior of this quality characteristic is the (X, RM) charts (also known as individual and moving-range charts) with a moving window of size 2. Their center lines for the two charts are X Chart Centerline = 10 RM Chart Centerline = 2.256 • Part (a): What is the value of sigma o? • Part (b): What is the upper control limit of the X chart? • Part (c): What should the CUSUM control limits be if k = 0.5 and h = 5? %D

MATLAB: An Introduction with Applications
6th Edition
ISBN:9781119256830
Author:Amos Gilat
Publisher:Amos Gilat
Chapter1: Starting With Matlab
Section: Chapter Questions
Problem 1P

Related questions
Question
M5
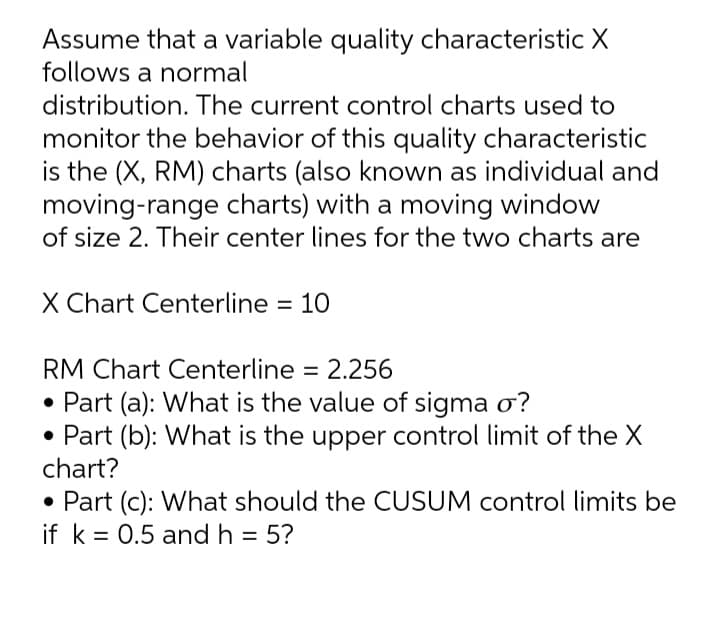
Transcribed Image Text:Assume that a variable quality characteristic X
follows a normal
distribution. The current control charts used to
monitor the behavior of this quality characteristic
is the (X, RM) charts (also known as individual and
moving-range charts) with a moving window
of size 2. Their center lines for the two charts are
X Chart Centerline = 10
RM Chart Centerline = 2.256
• Part (a): What is the value of sigma o?
• Part (b): What is the upper control limit of the X
chart?
• Part (c): What should the CUSUM control limits be
if k = 0.5 and h = 5?
Expert Solution
This question has been solved!
Explore an expertly crafted, step-by-step solution for a thorough understanding of key concepts.

Step by step
Solved in 3 steps

Recommended textbooks for you
MATLAB: An Introduction with Applications
Statistics
ISBN:
9781119256830
Author:
Amos Gilat
Publisher:
John Wiley & Sons Inc

Probability and Statistics for Engineering and th…
Statistics
ISBN:
9781305251809
Author:
Jay L. Devore
Publisher:
Cengage Learning

Statistics for The Behavioral Sciences (MindTap C…
Statistics
ISBN:
9781305504912
Author:
Frederick J Gravetter, Larry B. Wallnau
Publisher:
Cengage Learning
MATLAB: An Introduction with Applications
Statistics
ISBN:
9781119256830
Author:
Amos Gilat
Publisher:
John Wiley & Sons Inc
Probability and Statistics for Engineering and th…
Statistics
ISBN:
9781305251809
Author:
Jay L. Devore
Publisher:
Cengage Learning
Statistics for The Behavioral Sciences (MindTap C…
Statistics
ISBN:
9781305504912
Author:
Frederick J Gravetter, Larry B. Wallnau
Publisher:
Cengage Learning

Elementary Statistics: Picturing the World (7th E…
Statistics
ISBN:
9780134683416
Author:
Ron Larson, Betsy Farber
Publisher:
PEARSON

The Basic Practice of Statistics
Statistics
ISBN:
9781319042578
Author:
David S. Moore, William I. Notz, Michael A. Fligner
Publisher:
W. H. Freeman

Introduction to the Practice of Statistics
Statistics
ISBN:
9781319013387
Author:
David S. Moore, George P. McCabe, Bruce A. Craig
Publisher:
W. H. Freeman