Assume that adults have IQ scores that are normally distributed with a mean of u = 105 and a standard deviation o = 15. Find the probability that a randomly selected adult has an IQ between 89 and 121. Click to view page 1 of the table, Click to view page 2 of the table. 6 Standard Normal Table (Page 2) - X %3D The probability that a randomly selected adult has an IQ between 89 and 121 is (Type an integer or decimal rounded to four decimal places as needed.) POSITIVE z Scores Standard Normal (z) Distribution: Cumulative Area from the LEFT 03 05 .00 01 02 04 .06 07 08 09 0.0 .5000 5040 5080 5120 5160 5199 .5239 5279 S319 5359 0.1 5398 5438 5478 5517 5557 5596 5636 5675 5714 5753 0.2 5793 5832 5871 5910 5948 5987 6026 6064 6103 6141 .3 .4 0.5 0.3 6179 6217 6255 .6293 6331 6368 6406 6443 6480 6517 0.4 .6554 6591 6628 6664 6700 6736 6772 .6808 6844 .6879 6915 6950 6985 7019 7054 7088 7123 7157 7190 .7224 06 7257 7291 7324 7357 7389 7422 7454 7486 7517 7549 0.7 7580 7611 7642 7673 .7704 7734 .7764 7794 7823 7852 0.8 7939 7995 8023 BOS1 8315 7881 7910 7967 8078 8106 8133 0.9 8159 8186 8212 8238 8264 8289 8340 8365 8389 10 8413 8438 8461 8485 8508 8531 8554 8577 8599 8621 11 8643 8665 8686 8708 8729 8749 8770 8790 8810 8830 8962 1.2 1.3 8849 9032 8869 8888 8907 8925 8944 8980 8997 9015 9049 9066 9082 9099 915 .9131 9147 9162 9177 14 9192 9207 9222 9236 9251 9265 .9279 9292 9306 9319 15 9332 9345 9357 9370 9382 9394 9406 9418 9429 9441 16 9452 9495 . 9505 9463 9564 9474 9484 9515 9525 9535 9545 17 .9554 9573 9582 9591 9599 9608 9616 9625 9633 9641 9649 9656 9664 9671 9678 .9686 9693 9699 .9706 Enter your answer in the answer box. 19 9713 9719 9726 9732 9738 9744 9750 9756 9761 .9767 2.0 9772 9778 9783 9788 9793 9798 9803 .9808 9812 9817 2בבבצטצטמ .8eao33:3333
Assume that adults have IQ scores that are normally distributed with a mean of u = 105 and a standard deviation o = 15. Find the probability that a randomly selected adult has an IQ between 89 and 121. Click to view page 1 of the table, Click to view page 2 of the table. 6 Standard Normal Table (Page 2) - X %3D The probability that a randomly selected adult has an IQ between 89 and 121 is (Type an integer or decimal rounded to four decimal places as needed.) POSITIVE z Scores Standard Normal (z) Distribution: Cumulative Area from the LEFT 03 05 .00 01 02 04 .06 07 08 09 0.0 .5000 5040 5080 5120 5160 5199 .5239 5279 S319 5359 0.1 5398 5438 5478 5517 5557 5596 5636 5675 5714 5753 0.2 5793 5832 5871 5910 5948 5987 6026 6064 6103 6141 .3 .4 0.5 0.3 6179 6217 6255 .6293 6331 6368 6406 6443 6480 6517 0.4 .6554 6591 6628 6664 6700 6736 6772 .6808 6844 .6879 6915 6950 6985 7019 7054 7088 7123 7157 7190 .7224 06 7257 7291 7324 7357 7389 7422 7454 7486 7517 7549 0.7 7580 7611 7642 7673 .7704 7734 .7764 7794 7823 7852 0.8 7939 7995 8023 BOS1 8315 7881 7910 7967 8078 8106 8133 0.9 8159 8186 8212 8238 8264 8289 8340 8365 8389 10 8413 8438 8461 8485 8508 8531 8554 8577 8599 8621 11 8643 8665 8686 8708 8729 8749 8770 8790 8810 8830 8962 1.2 1.3 8849 9032 8869 8888 8907 8925 8944 8980 8997 9015 9049 9066 9082 9099 915 .9131 9147 9162 9177 14 9192 9207 9222 9236 9251 9265 .9279 9292 9306 9319 15 9332 9345 9357 9370 9382 9394 9406 9418 9429 9441 16 9452 9495 . 9505 9463 9564 9474 9484 9515 9525 9535 9545 17 .9554 9573 9582 9591 9599 9608 9616 9625 9633 9641 9649 9656 9664 9671 9678 .9686 9693 9699 .9706 Enter your answer in the answer box. 19 9713 9719 9726 9732 9738 9744 9750 9756 9761 .9767 2.0 9772 9778 9783 9788 9793 9798 9803 .9808 9812 9817 2בבבצטצטמ .8eao33:3333

MATLAB: An Introduction with Applications
6th Edition
ISBN:9781119256830
Author:Amos Gilat
Publisher:Amos Gilat
Chapter1: Starting With Matlab
Section: Chapter Questions
Problem 1P

Related questions

Question
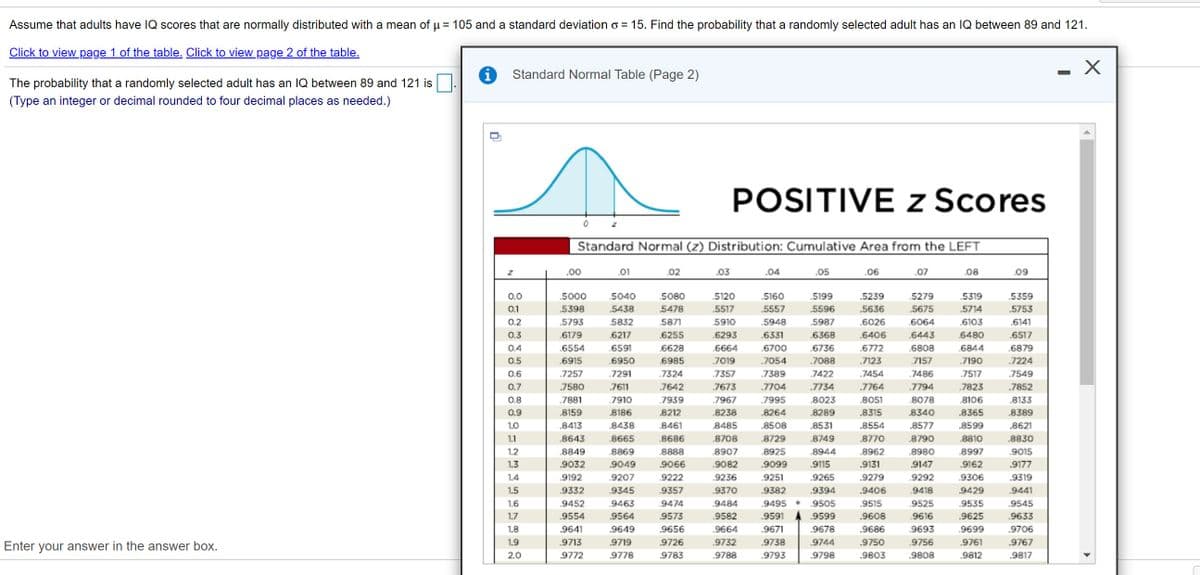
Transcribed Image Text:Assume that adults have IQ scores that are normally distributed with a mean of u = 105 and a standard deviation o = 15. Find the probability that a randomly selected adult has an IQ between 89 and 121.
Click to view page 1 of the table. Click to view page 2 of the table.
Standard Normal Table (Page 2)
The probability that a randomly selected adult has an IQ between 89 and 121 is
(Type an integer or decimal rounded to four decimal places as needed.)
POSITIVE z Scores
Standard Normal (z) Distribution: Cumulative Area from the LEFT
.00
.01
.02
.03
.04
.05
.06
.07
.08
.09
0.0
.5000
.5040
.5080
.5120
.5160
.5199
.5239
5279
.5319
.5359
0.1
.5398
.5438
5478
.5517
.5557
.5596
,5636
,5675
.5714
.5753
0.2
.5793
.5832
5871
5910
.5948
.5987
.6026
.6064
.6103
.6141
0.3
.6179
.6217
.6255
.6293
.6331
.6368
.6406
.6443
.6480
.6517
0.4
.6554
.6591
.6628
.6664
.6700
.6736
.6772
.6808
.6844
.6879
0.5
.6915
6950
.6985
7019
.7054
.7088
7123
7157
.7190
.7224
0.6
.7257
.7291
7324
7357
7389
7422
7454
7486
7517
.7549
0.7
.7580
.7611
.7642
.7673
.7704
.7734
.7764
.7794
.7823
.7852
0.8
.7881
7910
7939
7967
7995
.8023
.8051
.8078
.8106
.8133
0.9
8159
.8186
.8212
.8238
.8264
.8289
.8315
.8340
.8365
.8389
1.0
.8413
8438
8461
.8485
.8508
.8531
.8554
.8577
,8599
.8621
1.1
.8643
8665
8686
8708
.8729
.8749
.8770
.8790
.8810
.8830
.8980
.9147
1.2
.8849
.8869
8888
.8907
.8925
.8944
.8962
.8997
.9015
1.3
.9032
.9049
.9066
.9082
.9099
.9115
.9131
.9162
.9177
1.4
.9192
9207
9222
.9236
.9251
.9265
.9279
9292
.9306
.9319
1.5
.9332
9345
9357
.9370
.9382
.9394
.9406
.9418
.9429
.9441
1.6
.9452
9463
9474
9484
.9495 9505
,9515
9525
,9535
.9545
1.7
.9554
.9564
.9573
.9582
.9591
.9599
.9608
.9616
.9625
.9633
1.8
.9641
.9649
.9656
.9664
.9671
.9678
.9686
9693
.9699
.9706
1.9
.9713
.9719
.9726
.9732
.9738
.9744
.9750
.9756
.9761
.9767
Enter your answer in the answer box.
2.0
.9772
.9778
.9783
.9788
.9793
.9798
.9803
.9808
.9812
.9817
Expert Solution
This question has been solved!
Explore an expertly crafted, step-by-step solution for a thorough understanding of key concepts.

This is a popular solution!

Trending now
This is a popular solution!

Step by step
Solved in 2 steps with 1 images

Knowledge Booster


Learn more about
Need a deep-dive on the concept behind this application? Look no further. Learn more about this topic, statistics and related others by exploring similar questions and additional content below.Recommended textbooks for you
MATLAB: An Introduction with Applications
Statistics
ISBN:
9781119256830
Author:
Amos Gilat
Publisher:
John Wiley & Sons Inc

Probability and Statistics for Engineering and th…
Statistics
ISBN:
9781305251809
Author:
Jay L. Devore
Publisher:
Cengage Learning

Statistics for The Behavioral Sciences (MindTap C…
Statistics
ISBN:
9781305504912
Author:
Frederick J Gravetter, Larry B. Wallnau
Publisher:
Cengage Learning
MATLAB: An Introduction with Applications
Statistics
ISBN:
9781119256830
Author:
Amos Gilat
Publisher:
John Wiley & Sons Inc
Probability and Statistics for Engineering and th…
Statistics
ISBN:
9781305251809
Author:
Jay L. Devore
Publisher:
Cengage Learning
Statistics for The Behavioral Sciences (MindTap C…
Statistics
ISBN:
9781305504912
Author:
Frederick J Gravetter, Larry B. Wallnau
Publisher:
Cengage Learning

Elementary Statistics: Picturing the World (7th E…
Statistics
ISBN:
9780134683416
Author:
Ron Larson, Betsy Farber
Publisher:
PEARSON

The Basic Practice of Statistics
Statistics
ISBN:
9781319042578
Author:
David S. Moore, William I. Notz, Michael A. Fligner
Publisher:
W. H. Freeman

Introduction to the Practice of Statistics
Statistics
ISBN:
9781319013387
Author:
David S. Moore, George P. McCabe, Bruce A. Craig
Publisher:
W. H. Freeman